FUEL & FUEL SYSTEM MICROBIOLOGY PART 13 –TEST METHODS – MORE ON MICROBIOLOGICAL TESTS
In Part 12, I discussed culture testing. One of the points I made was that any given culture test (of which there are >5,000) is unlikely to detect >1 % of all of the microbes present. Before moving on to discuss methods that detect more of the microbes present – in terms of percent detection of each type of microbe and the fraction of the different microbes present that are detectable – I will invoke one of Donald Rumsfeld’s most famous quotes:
“There are known knowns. These are things we know that we know. There are known unknowns. That is to say, there are things that we know we don’t know. But there are also unknown unknowns. There are things we don’t know we don’t know.”
Although, in February 2002, when Secretary of Defense Rumsfeld offered this statement, he was discussing the possibility that Iraq had weapons of mass destruction; he could just as well been talking about microbial contamination condition monitoring. In Part 12’s fig 1, I indicated that genomic testing (you’ll have to wait until Blog Post 15 or 16 for more on genomics) detected a greater proportion of the total microbiome (all of the microbes present in a particular environment) than any other method currently available. However, I also noted that I doubted if current genomic testing detected more than 80% of a given microbiome. This begs the question: “If no method provides a perfect measurement of microbial contamination, which one should I use?”
The perhaps ungratifying answer is: “It depends on your intention.” Let’s start with an illustration. Fig 1 illustrates three ways to take a measurement. You can use a ruler or tape measure to determine an object’s dimensions. If It is a liquid, you can use a measuring cup or graduated cylinder to determine its volume. You can also use a scale to determine its weight. Each of these is a valid measurement, but each provides different information.

It’s the same thing with testing from microbial contamination. Each method that I illustrated in Blog Post 12, figure 1, provides useful information about the microbial population, but each provides different information. If you need to have pure cultures of microbes, on which to do research, culture testing is the most appropriate tool. If, however, you want to quickly determine how heavily contaminated your system is, then one of the chemical microbiology test methods is a better choice.
A chemical microbiology test method is a method that detects specific molecules that are either part of or are produced by microbes. The three chemical microbiology methods illustrated in Fuel Microbiology Part 12 are: catalase activity, adenosine triphosphate concentration, microbial antigen detection.
Today, I’ll write about the catalase test. In the interest of full disclosure, in the early 1980’s, after a University of Houston graduate student developed the HMB catalase test method (www.biotechintl.com), I did most of the method validation for a variety of industrial applications. I also developed ancillary HMB tests to verify that the test results were due to microbes. Starting in 1982, and for the next 27 years, the HMB was my primary field test for detecting and quantifying microbial contamination in industrial fluid systems.
The catalase test is based on the reaction between the enzyme catalase and hydrogen peroxide. Catalase is the enzyme that made life in an oxygen-rich atmosphere possible. Cells that grow in normal air (aerobes) produce hydrogen peroxide as part of their energy metabolism. Catalase converts that hydrogen peroxide into water and oxygen. What makes the HMB test quantitative are its two primary components: a patented, electronic pressure gauge (figure 2a) and a stoppered reaction tube (figure 2b).
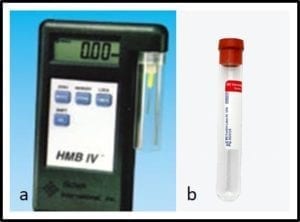
The HMB pressure gauge is unique because there’s very little volume between its probe and its sensor.
The stoppered reaction tube provides a fixed volume, so that headspace pressure increases as the concentration of oxygen gas increases within that space (the head space is the space between the top of the liquid and bottom of the stopper).
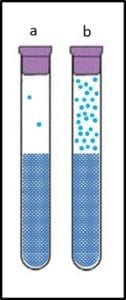
To run the test, add a standard sample volume (typically either 3 mL or 10 mL) to a reaction tube, and then add concentrated hydrogen peroxide (one drop – = 0.05 mL – per mL of sample). Quickly replace the tube’s stopper (it is a septum cap that re-seals itself after it has been pierced with a needle) and briefly vent the tube. This ensures that the headspace pressure is 0 psig when the reaction starts. If there are aerobic microbes in the sample, they will race to convert the hydrogen peroxide to water and oxygen gas, before the hydrogen peroxide kills them. In the meantime, as oxygen is produced, it accumulates in the reaction tube’s head space. The universal gas law teaches that if temperature and volume are constant, the pressure in an enclosed space is proportional to the concentration of gas in that space. Simply put: the more catalase enzyme in the sample, the more oxygen in the headspace; the more oxygen the greater the pressure increase (fig 3). The reaction runs its course in <15 min. At 15 min, stick the reaction tube with the needle that’s attached to the pressure gauge (fig 1a) and read the psig. The psig reading at 15 min is proportional to the microbial contamination load. Correlation between culture test data and HMB catalase test data is generally very strong.
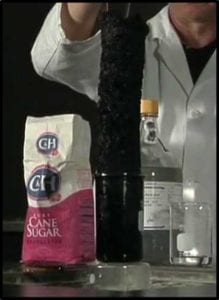
However, the HMB test has its limitations. First: it only detects organisms that have the catalase enzyme. This excludes all anaerobes (microbes that only grow in oxygen-free environments) and aerobes that don’t have a complete catalase enzyme. Second: dissolved iron reacts with hydrogen peroxide to release oxygen gas. Samples with dissolved oxygen will appear to have microbial contamination. Third: at ∼25 psig the pressure is sufficient to launch the reaction tube’s stopper. The noise can be disconcerting and flying stoppers can be eye hazards. Moreover, the foam pouring over the reaction tube’s wall creates a mess. When microbiological contamination is negligible, it generates <1.5 psig pressure. Heavily contaminated samples (many bottoms-water samples) will foam over before the reaction tube’s stopper can be put in place (have you ever seen the reaction when sulfuric acid is poured over a sugar cube; fig 4?). When this occurs, the sample must be diluted to get a quantitative test result. On the few occasions when curiosity has compelled me to get a quantitative answer, after observing a violent reaction in the original sample, I’ve found that the actual psig was 20,000 to 30,000 psig (yes, I had to dilute samples 10,000 to 50,000-fold in order to get a psig reading). Normally, either being unable to get the stopper onto the tube, or having the stopper launch before the end of the 15 min test period, provide the information I need to determine that the sample is heavily contaminated.
Earlier, I mentioned that I had developed ancillary tests for the HMB catalase test. One is used to determine if dissolved iron is producing a false positive result. The other is used to inactivate any enzymes in the sample. When testing unknown samples (i.e.: I don’t know whether they sample is likely to have dissolved iron), I run four tests: hydrogen peroxide (H2O2) only, H2O2 + a chelating reagent (prevents the dissolve iron reaction), H2O2 + a poison (inhibits catalase activity), and H2O2 + chelating reagent + poison (serves as a background control). The H2O2 result tells me if there is a contamination issue. If the chelating reagent reduces the psig by >90 %, then the psig observed in the H2O2 only test is due to dissolve iron. Similarly, if the chelator has no effect but the poison reduces the psig by >90 %, then the psig observed in the H2O2 only test is due to microbes. If both the chelator and poison are needed to reduce the psig by >90 %, then the sample has substantial concentrations of dissolved iron and microbial contamination.
With all of these limitations, why use the HMB test? The truth is, for those 27 years during which I relied on it, the HMB test was the best test available for my specific objectives: to be able to obtain a sample and obtain reasonably reliable, quantitative microbiological data, quickly (15 min), near the point of sampling. These days, I compare the test method to early portable phones and so-called laptop computers (the former weighed in at > 10 lb., and the latter at > 20 lb.) At the time they were introduced, they did their respective jobs better than anything else available. I hope that you are now wondering: What test replaced the HMB test? That will be the topic of Part 14. Stay tuned…
In the meantime, if you’d like to learn more about fuel and fuel system microbiology testing, please contact me at fredp@biodeterioration-control.com.