BIODETERIORATION ROOT CAUSE ANALYSIS – PART 1: FIRST STEPS

What is root cause analysis?
Root cause analysis (RCA) is the term used to describe any of various systematic processes used to understand why something is occurring or has occurred. In this post and several that follow, I’ll focus on an approach that I have found to be useful over the years. Regardless of the specific tools used effective RCA includes both subjective and objective elements. The term root cause is often misunderstood. The objective of RCA is to identify relevant factors and their interactions that contribute to the problem. Only on rare occasions will a single cause be responsible of the observed effect. The cause-effect map of the Titanic catastrophe – available at thinkreliability.com – illustrates this concept beautifully. Although striking an iceberg was the proximal (most direct) cause of the ship sinking, there were numerous other contributing factors.
Typically, the first step is the recognition of a condition or effect. Recognition is a subjective process. An individual looks at data and makes a subjective decision as to whether they reflect normal conditions. The data on which that decision is made are objective. RCA tools use figures or diagrams to help stakeholders visualize relationships between effects and the factors that potentially contribute to those effects. Figure 1 illustrates the use of Post-it® (Post-it is a registered trademark of 3M) notes on a wall to facilitate RCA during brainstorming sessions.

This simplistic illustration shows how RCA encourages thinking beyond the proximal cause(s) of undesirable effects.
RCA Universal Concepts
At first glance, the various tools used in RCA seem to have little in common. Although the details of each step differ among alternative RCA processes, the primary elements remain the same. Figure 2 illustrates the primary RCA process steps.

Step 1. Define the problem
For millennia, sages have advised that the answers one gets depend largely on the questions one asks. The process of question definition – also called framing – is often given short shrift. However, it can make all the difference in whether or not an RCA effort succeeds. Consider reduced flow in systems in which a fluid passes through one or more filters. As I’ll illustrate in a future article, reduced flow is commonly reported as filter plugging. To quote George Gershwin’s lyrics from Porgy and Bess: “It Ain’t Necessarily So.” Failure to define a problem properly can result in wasted time, energy, resources, and ineffective RCA.
Step 2. Brainstorm
Nearly every cause is also an effect. Invariably, even the nominally terminal effect is the cause of suboptimal operations. Brainstorming is a subjective exercise during which all stakeholders contribute their thoughts on possible cause-effect relationships. The Post-it® array shown in Figure 1 illustrates one tool for capturing ideas floated during this brainstorming effort. On first pass, no ideas are rejected. The objectives are to identify as many contributing factors (causes, variables) as stakeholders can, collectively, and to map those factors as far out as possible – i.e., until stakeholders can no longer identify factors (causes) that might contribute – however remotely – to the terminal effect (i.e., the problem). Two other common tools used to facilitate brainstorming are fishbone (Ishikawa or herringbone) diagrams (Figures 3 and 4), and Cause-Effect (C-E) maps (Figure 5). Kaoru Ishikawa introduced fishbone diagrams in the 1960s. Figure 3 shows a generic fishbone diagram. The “spine” is a horizontal line that points to the problem. Typically, six Category lines radiate off the spine. Horizontal lines off of each category line are used to list causes related to that category. One or more sub-causes can be associated with each cause.
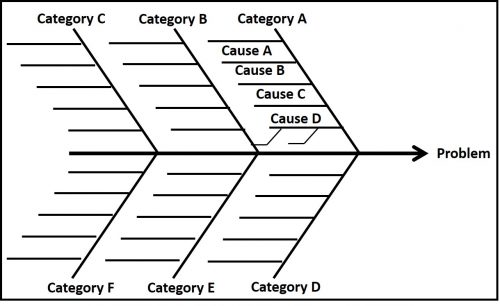
Figure 4 illustrates how a fishbone diagram can be used to visualize cause-effect relationships contributing to a balloon popping.

The six categories – Environment, Measurement, Materials, Machinery, Methods, and Personnel – are among those most commonly used in fishbone diagramming. Keep in mind that at this point in RCA, the variables captured in the diagram are speculative. Only the fact that the balloon has popped is know for certain.

My preferred tool is C-E mapping. The cells in a C-E map suggest causal relationships – i.e., a causal path. This is similar to repeatedly asking: why?” and using the answers to create a map. In Figure 5, there are three proximal causes to the Balloon Popped effect. The balloon popped because it was punctured, over-heated, or overinflated. In this illustration only the possible causes of Punctured are illustrated. The two possible causes are Intention and Accident. In turn, Intention could have been the effect of either playfulness or anger. The accident could have been caused by handing the balloon with the wrong tool (hands with sharp nails?) or having applied too much pressure. Although Figure 5 shows three tiers of causes, it could be extended by several more tiers. For example, why was the individual handling the balloon angry? Why did whatever made them angry occur? As I’ll illustrate in a future article, one advantage of C-E mapping is that the entire diagram need not be shown in a single figure. Each listed cause at each tier can be used as the ultimate effect for a more detailed C-E map. Another advantage is that ancillary information can be provided alongside each cause cell (Figure 6).

In my next article, I’ll continue my explanation of RCA, picking up the story with Define Current Knowledge and will use a biodeterioration case study to illustrate each step.
Summary
In RCA, the objective is to look beyond the proximal cause. My intention now is to explain why this is valuable. I recognize that some readers are Six-Sigma Black Belts who understand RCA quite well. Still, all too frequently, I encounter industry professionals who invariably focus no proximal causes and wonder why the same symptoms continually recur.
For more information, contact me at fredp@biodeterioration-control.com.
