The Problem With Statistics – It’s Not The Statistics, But How We Abuse Them
A 23 June 2020 United Press International (UPI) headline in Health News (proclaims: “Less than half a population needs COVID-19 infection for herd immunity, study says.”
The report goes on to state: “The modeling study found that herd immunity potentially could be achieved with about 43 percent of the population being immune, as opposed to the 60 percent estimate derived from previous models.” This is based on modelling work done by a member of the University of California-Riverside faculty. As I read the article my thoughts again turned to the observation about lies, damned lies and statistics (variously ascribed to Samuel Clemens, Benjamin Disraeli, and various other mid-19th century sources).
What population?
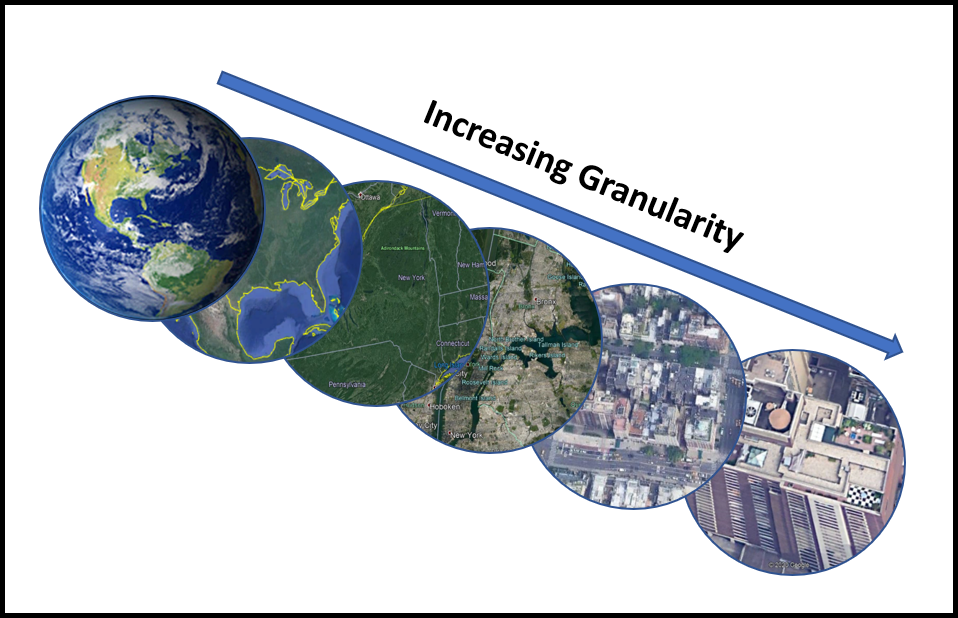
I’m not quibbling with the model used to compute the statistic, but do have an issue with how the article’s writer used it (note: having been misquoted on occasion, I cannot say that the statistic that appeared in the UPI article captured the cited investigator’s intent accurately. My issue is about granularity – the scale or level of detail present in a set of data or other phenomenon. I illustrate my point in figure 1. All of the images include New York City ranging from a satellite image (least granular) to an aerial photo of a single building on the northeast corner of 96th Street and 5th Avenue (most granular).
The 43 % statistic cited above is meaningless unless it incudes a statement about granularity. If applied globally, it ignores the possibility that in some countries, the majority of the population might be immune while in others, the percentage of immune individuals might be substantially less than the 43 % threshold for herd immunity. Moving across the granularity spectrum, will it be sufficient to consider 43 % immunity for an entire city, or will 43 % of the residents of each building need to be immune?
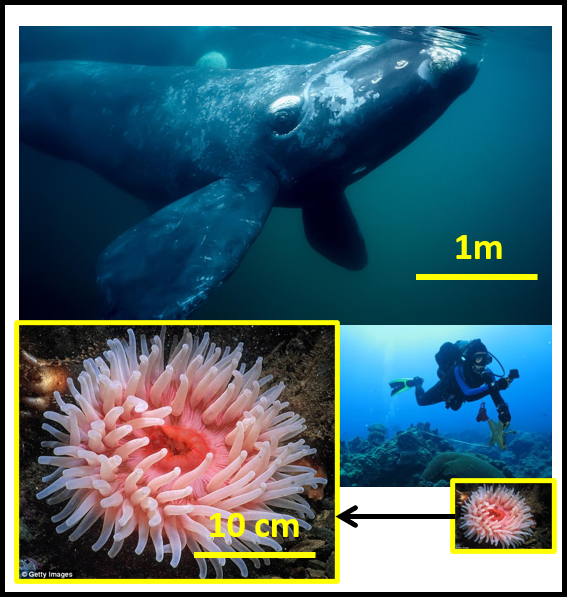
Nowhere in the article was there any indication of the geographic area within which herd immunity would be achieved once 43 % of the population was immune to COVID-19. The result is a misleading article. Note that is possible to focus too closely on the details – as in missing the forest for the trees. My personal object lesson was having focused on a sea anemone (size ∼10 cm wide by 15 cm tall) while a whale swan directly over my head (figure 2 – not actual photos of the 1975 event). As I came out of the water, people asked if I had photographed the whale. I responded: “What whale?”
Herd Immunity and Physical Distancing
Guidelines from the Centers for Disease Control (CDC) and World Health Organization (WHO) indicate that we should maintain physical spacing of at least 6 ft (~2m) for other people to prevent transmission of the SAR-CoV-2 virus from communicable individuals to susceptible ones. If there are a group of people in a room – say a restaurant on a New York city block on which more than 43 % of the residents are COVID-19 immune – how will that affect physical distancing requirements? Based on the statistics cited in the UPI article, I have no idea. Apparently, nor does anyone else. There are simply insufficient data from which to draw an objective conclusion.
Statistics Abuse – There’s the Rub
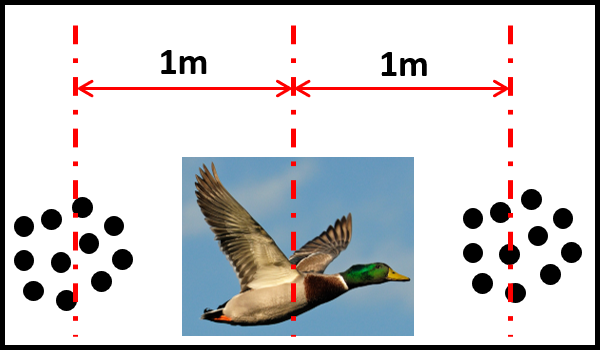
There’s an old joke about a duck hunter who fires his shotgun twice at a duck flying overhead (figure 3). His first shot flies past the duck, ∼1 m ahead of the bird and the second misses by the same distance behind it. The hunter proclaimed that one average (the midway point between the two shots) the duck was killed – except that it wasn’t (note: no ducks were harmed in the retelling of this statistics tale). Statistics is a branch of mathematics that provides elegant tools for distilling large amounts of data into useable form. That’s the science. The art is in marrying statistical analysis to other observations and logical thinking. Statisticians are the first to caution users to recognizes that their calculations are always in the context of probabilities. What is the probability that an apparent pattern (relationship) is simply random? What is the probability that a seemingly random pattern hides an important relationship? What is the impact of interpreting the statistics incorrectly?
What does this all mean?
Since my last post in May, epidemiologists and other public health experts have been trying their best to refine models for risks related to exposure to SAR-CoV-2, contraction of COVID-19, and alternative measures for ending the pandemic. In that in that post, I discussed risk versus hazard and the concept of acceptable risk. Within our free society, some citizens believe exposure to SAR-CoV-2 is an acceptable risk and have decided that no precautions are necessary. Recent spikes in the morbidity rate (i.e., number of new cases per 100,000 people in a given area) have reflected the wisdom (better: lack thereof) of ignoring the imperfect science. Presumably, at some point in the next few months, populations in many areas of the U.S. will approach the percent immunity targets identified in the UPI article. At that point, the risk of non-immune individuals contracting the disease will fall to a level that elected officials and business leaders deem acceptable. Will they be right or is acceptable risk in the eyes of the beholder?
I’m writing this to stimulate discussion, so please share your thoughts either by writing to me at fredp@biodeterioration-control.com or commenting to my LinkedIn post. Also, on 29 July at noon, Eastern Daylight Time, Dr. John Howell, Dr. Neil Canter, Mr. Bill Woods, and I will participate in an STLE webinar panel discussion on COVID-19 risk in the machine shop work environment.
