FUEL & FUEL SYSTEM MICROBIOLOGY PART 32 – FUEL SYSTEM DISINFECTION REVISITED
Questions from a colleague
Today’s post was inspired by a text message I recently received from a colleague. His message contained two questions. First, he asked whether fuel tank microbicide treatment could select for resistant microbes. Second, he asked about how best to treat microbially contaminated fuel systems.
I addressed microbicide selection in Part 21 (July 2018) and treatment strategies in Part 22 (August 2018). Today’s post will include some content from these two earlier posts as I focus on the questions of microbicide resistance and effective dosing strategy.
The Short Answer
- Microbes in fuel systems can become microbicide resistant.
- The two most common reasons microbes become resistant are:
- – Underdosing
- – Inadequate exposure period (soak-interval).
- To minimize the risk of a system developing resistant microbes:
- – Use the maximum permissible dose when treating systems
- – Don’t expect microbicide treatment alone to disinfect heavily infected fuel systems
- – Repeat treatments until microbial population is adequately controlled.
What is Microbicide Resistance?
The news has contained an increasing number of reports about antibiotic resistant microorganisms (ARMs). If you are not familiar with ARMs, I recommend this Centers for Disease Control (CDC) webpage for an excellent overview of the issue. Briefly, ARMs are strains of disease-causing microbes (pathogens) that have mutated successfully to become tolerant (if not 100 % impervious) to a broad range of antibiotics. Almost invariably, antibiotic resistance is due to successful mutations. A mutation is a change in a cells’ genetic code. This change is passed along from one generation to the next. A successful mutation is one that enables the mutant to compete favorably against its non-mutant neighbors. In bacterial populations approximately one cell per million is a mutant but not all mutations are successful. When exposed to sub-lethal antibiotic concentrations, more cells within the target population are able to mutate successfully.
Remember that the generation times (time in which the population doubles) for bacteria range from 0.5h to several days. If an antimicrobial substance is repressing the growth of non-mutant cells but not mutants, it does not take long for the mutants to become the dominant population. Voilà, the treatable microbes have been replaced by resistant one.
Industrial microbicide (microbicide) resistance is a bit more complicated. There is still plenty of debate on which of two mechanisms is most common. There is considerable evidence that mutation – just as for ARMs – is one of the ways microbial populations become microbicide resistant. However, there is also evidence that by selectively killing the fastest growing microbes, microbicides can select for slower growing ones. This is a case of eliminating the competition. Non-oxidizing microbicides – i.e., all of the ones used for fuel-treatment – target cell components (i.e., enzymes, genetic material, cell wall molecules, etc.). Typically, non-oxidizing microbicides are most effective against rapidly growing microbes – the faster you eat, the more poison you ingest; the more poison you ingest, the faster you die. This means dormant and slowly growing microbes tend to be more bioresistant than their metabolically active neighbors. Dormant microbes (sometimes called persister cells) are similar to bacterial endospores – they are inactive – but do not have the definitive spore structure that characterizes endospores (figure 1).
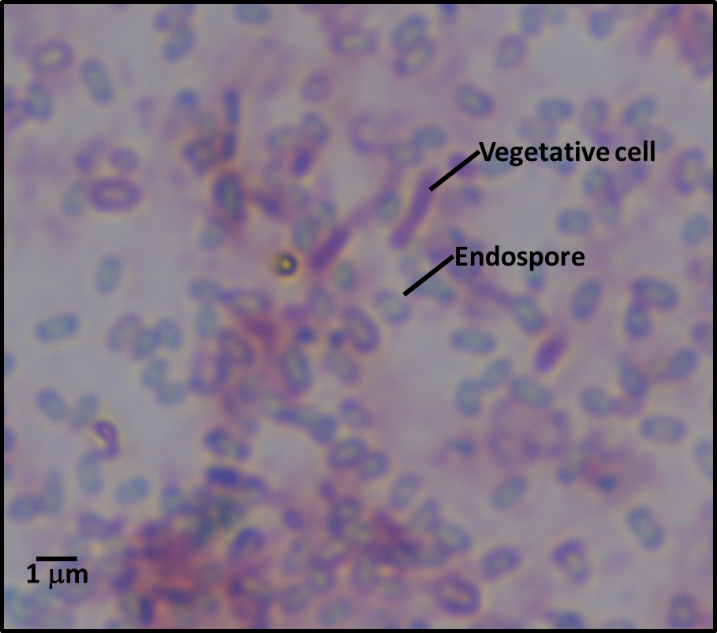
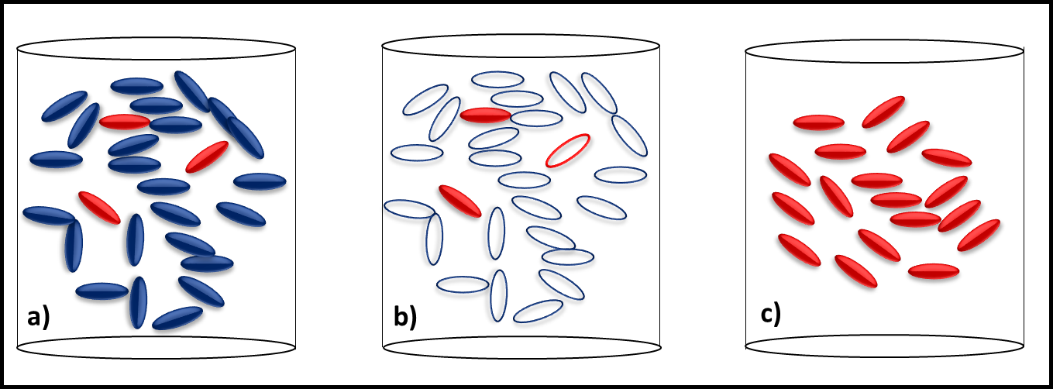
Figure 2 illustrates the how slow growing microbes can become the dominant contaminant population after microbicide treatment kills all of the faster growing microbes. Before treatment, the slow growers (red cells) are a minor part of the total population dominated by fast-growers (blue cells) (figure 2a). Treatment kills all of the fast-growing cells but leaves most of the slow-growers intact (figure 2b). With their competition eliminated, the slow-growers eventually become the dominant population (figure 2c). Since these microbes were microbicide-resistant originally, they develop into a microbicide-resistant, contaminant population.
Note, in this case, the resistant microbes were never fully susceptible to the microbicide used. They did not mutate in response to the treatment. Note also, resistance happens when a cell that has been exposed to a normally toxic concentration of the microbicide survives. As I’ll discuss below, microbicide treatment can be ineffective if the chemical does not come into contact with cells.
Insufficient Microbicide Concentration Impact
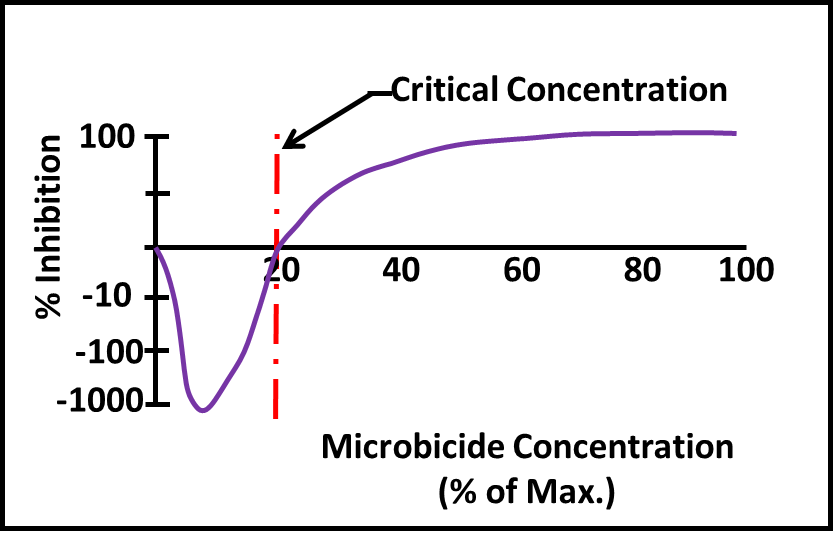
Figure 3 (this is a copy of figure 3 from Part 22) illustrates the impact of underdosing. The critical concentration is the minimum dose at which a microbicide has some kill effect. At concentrations less than the critical concentration, microbicides trigger increased metabolic activity and cell proliferation. The maximum permissible concentration for the microbicide used in figure 3 is 1,000 ppm (vol). At ≥600 ppm (60 % maximum) it does a good job of killing the target microbes. At 200 ppm it has no effect and at concentrations <200 ppm it stimulates growth (i.e. % Inhibition is <0). This phenomenon – called hormesis – doesn’t mean the population is healthy. The population is actually working hard to counter the poison’s effect. If you’ve ever seen Arsenic and Old Lace, you’ve seen an hormesis case study. There was a time when people used tonics containing arsenic as stimulants. Low doses seemed to increase user’s vigor, but higher doses – not surprisingly – were lethal.
Insufficient Exposure Period Impact
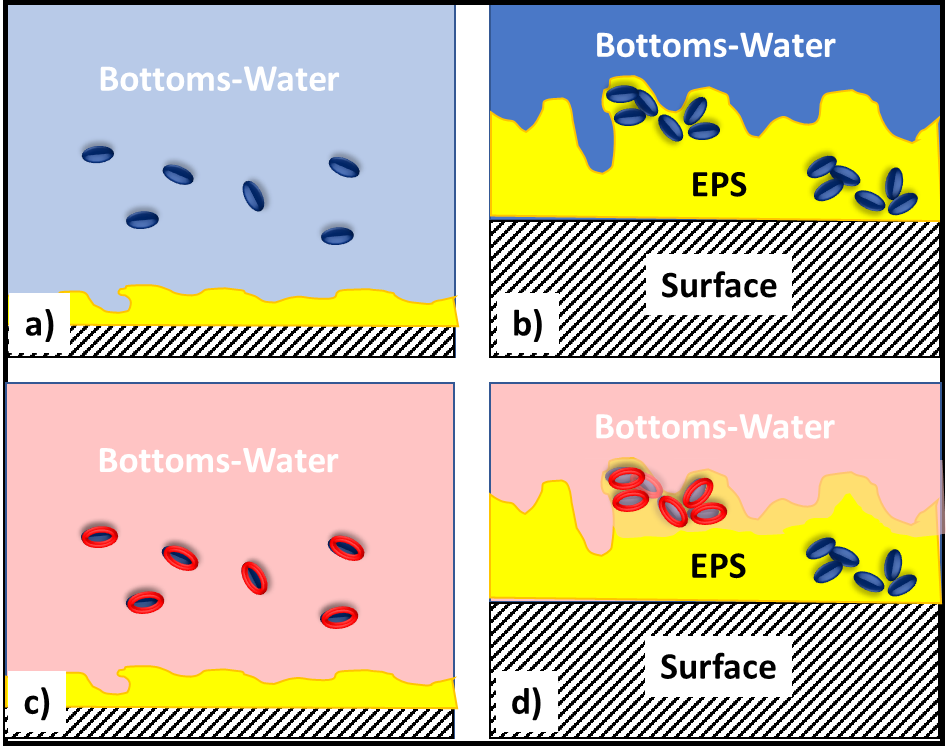
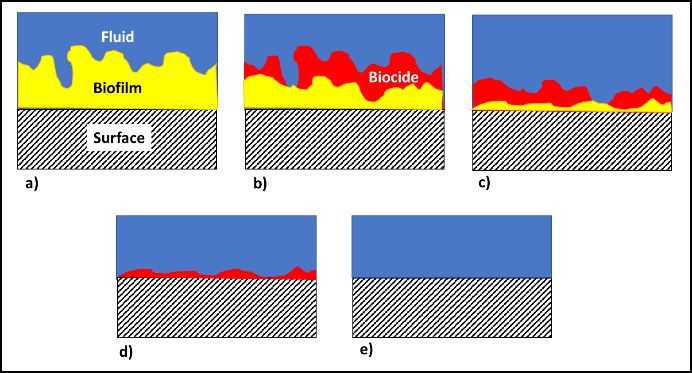
In fuel systems, microbes are either suspended (planktonic – figure 4a) or embedded (sessile) within biofilms (figure 4b). Microbicide treatment typically makes short work of planktonic cells. This is because each cell is exposed to a lethal dose (figure 4c). However, microbicides are unable to reach cells that are embedded within a biofilm’s extracellular polymeric matrix (EPS – figure 4d). Note that cells near the EPS-bulk fluid interface are killed but those deep with the EPS matrix are protected. Figure 4 illustrates how a single treatment, using an effective microbicide, can fail to disinfect a system.
The commonly used fuel-treatment microbicide manufacturers recommend 24h to 48h soak periods. Given that most contamination develops on the bottom third of tank surfaces, dosing just before a fill should provide the recommended amount of contact time. This will effectively kill the planktonic population and cells within biofilms that are <2 mm (1/8 in) thick. For thicker biofilms, multiple treatments will be necessary. As illustrated in figure 5 (copied from Post 22) each time you add microbicide it will kill the microbes in, and disperse the EPS from, the biofilm’s outer surface. If microbicide is being used alone, it can require three or more treatments – each delivered three to five days after the preceding dose. In figure 5, three treatments were needed to achieve tank wall disinfection.
Does Disinfection Make Matters Worse?
Microbicides are developed to kill microbes, not to clean system surfaces. Best practice is to combine microbicide treatment with physical and chemical surface cleaning. If a system has substantial biofilm accumulation on its surfaces, microbicide treatment is likely to release chucks of biofilm and cells that will rapidly plug filters. For details on how to deal with this issue, refer to Part 23 on post-treatment system cleanup.
If linking microbicide treatment with system cleaning is not practical, the alternative is to treat repeatedly until:
- a) Masses of dispersed biofilm are no longer plugging filters, and
- b) Microbiological test results are below detection levels (negative).
The Details
For more details about disinfecting fuel systems, please contact me at either fredp@biodeterioration.control.com or 01 609.306.5250.
