FUEL & FUEL SYSTEM MICROBIOLOGY PART 16 –TEST METHODS – LATERAL FLOW DEVICE
Quick review:
In post #12 I provided an overview of microbiological testing.
Next (post #13) I launched my discussion of non-culture tests.
In posts #14 and #16 – post #15 captured my impressions of the fuel microbiology sessions at two conferences – I discussed how ATP testing could be used to measure microbiological contamination in both liquid and solid samples (surface swabs and sections of filter media).
Before moving on from microbiological test methods, I want to cover two more non-culture test methods. The first – ASTM D8070 (Method for Screening of Fuels and Fuel Associated Aqueous Specimens for Microbial Contamination by Lateral Flow Immunoassay; https://www.astm.org/Standards/D8070.htm) – is another test that can easily be run immediately after collecting a fuel, bottoms-water, or mixed sample. The second, quantitative polymerase chain reaction (qPCR) is a laboratory test that is still too complicated for use by field technicians. I’ll discuss qPCR in my next post.
ASTM D8070 is based on a test kit manufactured by Conidia Biosciences Ltd (http://conidia.com/industry/marine-2/detect-diesel-bug/). The lateral flow device (LFD) technology is very similar to that used for pregnancy tests. A few drops of test fluid are dripped into a well at one end of the LFD, the fluid wicks across a filter pad, and the fluid reacts with an antibody cocktail (a mixture of antibodies designed to detect the target microbes). The kit has six LFD assembled as three pairs on a panel (fig 1). The top pair detects bacteria. The middle pair detects fungi, and the third pair detects one particular type of fungus. Within each pair, one LDF detects high antigen concentrations and the other detects low antigen concentrations. For each microbe category the results are negligible, moderate or heavy (fig 2). Each LFD has a control line (always visible) and a test line (visible only if the antigen concentration is below the LFD’s detection limit). If target microbe molecules (antigens) are present in the sample, the test line remains invisible. Thus, figure 2, shows that the sample had heavy bacterial and moderate fungal contamination levels, and insignificant Hormoconis resinae levels. Historically, some fuel microbiologists were convinced that H. resinae was the predominant microbe that contaminated fuels. I suspect that the D8070 kit has retained the H. resinae LFDs for nostalgic, rather than technical reasons.
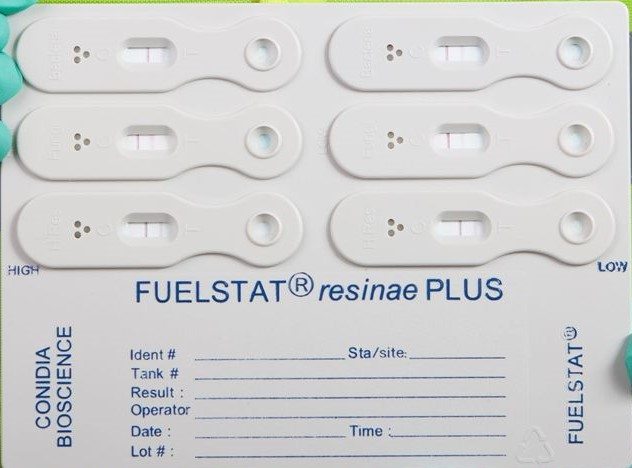
Fig 1. Unused ASTM D8070 panel showing red, control line in each of the six LFD.
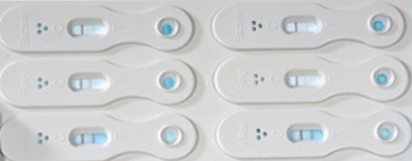
Fig 2. Used ASTM D8070 panel. Top row: heavy bacterial contamination (no visible test line on either LFD); middle row: moderate fungal contamination (visible test line on left LFD, but not on right); bottom row: negligible Hormoconis resinae contamination (test lines visible on both LFD).
In 2015 an ASTM interlaboratory study was run on fuel and bottoms-water samples. The samples were tested by ASTM D7687 (Method for Measurement of Cellular Adenosine Triphosphate in Fuel and Fuel-associated Water with Sample Concentration by Filtration) and D8070. A comparison of the bacterial contamination results from the two methods showed 83 % agreement. Recall from post # 12, that each microbiological test method measures something different. Culture tests use microbes’ ability to reproduce and form visible masses (colonies) on nutrient media. The catalase test measures the concentration of an enzyme that’s present in many different types of oxygen-requiring microbes. ATP testing measures the concentration of a universal energy molecule. The LFD test detects antigens that react (actually: bind with) antibodies selected for their diagnostic usefulness. Consequently, strong agreement between two different test methods provides a means of validating both methods.
No method is without its limitations. D8070 provides attribute scores (three distinct categories) rather than quantitative results. For some users, this might be sufficient. Other users might prefer quantitative results (for example CFU/mL or pg ATP/mL). Inexperienced users might see test lines that are not there (for example, if you look very closely at figure 1, you can see a very faint test line on the unused, top right LFD), or miss lines that are. Still the method is useful for quickly distinguishing between bacterial and fungal contamination. In selected cases, I find it to be a great tier 2 test. If I detect sufficient ATP, I’ll run D8070 to determine whether the ATP is bacterial, fungal, or a combination of both.
If you’d like to learn more about fuel system microbiology, please contact me at fredp@biodeterioration-control.com.
