FUEL & FUEL SYSTEM MICROBIOLOGY PART 33 – Connecting the Dots, Part 1
What do Microbiology Test Results Mean?
This is actually a double question that I hear quite often. In one sense, I’m asked: “Do my microbiology test results tell me conclusively whether microbes are damaging my fuel or fuel system?” In another sense, the question means: “Why don’t the results from different fuel microbiology test kits always agree?” Today’s post is the first of three in which I’ll write about how to make sense of microbiology data.
Do My Microbiology Test Results Tell Me Conclusively Whether Microbes are Damaging My Fuel or Fuel System?”
In a word: No. Let’s first consider fuel biodeterioration. In Part 2, I’ll write about system (infrastructure) biodeterioration. I’ll wait until Part 3 to explain why the results from different microbiology tests do not always agree.
Fuel Biodeterioration
In small microcosms, it is fairly easy to see the following fuel properties change due to biodeterioration:
- Oxidative stability – decreases
- Octane or cetane number – decreases
- Carbon number distribution (simulated distillation curve) – shifts towards more complex molecules and molecules with more carbon atoms.
- Corrosivity – increases
- Total acid number – increases
- Particulates – size and total number both tend to increase.
The larger the total fuel volume, the less likely these symptoms will be detectable. This is because the affected fuel is a minuscule fraction of the total fuel volume. Because the affected fuel is diluted in unaffected fuel, changes to the affected fuel become immeasurably small. Moreover, in high throughput systems, the contact zone between microbes and fuel is short – too short to give microbes time to attack the fuel. In long term storage systems, analysis are more likely to see differences between bottom fuel samples and those taken higher in the fuel column.
In addition to the dilution effect, in most fuel systems stratification and hydrodynamics create three primary zones. Figure 1 illustrates how a typical high throughput tank has three such zones.
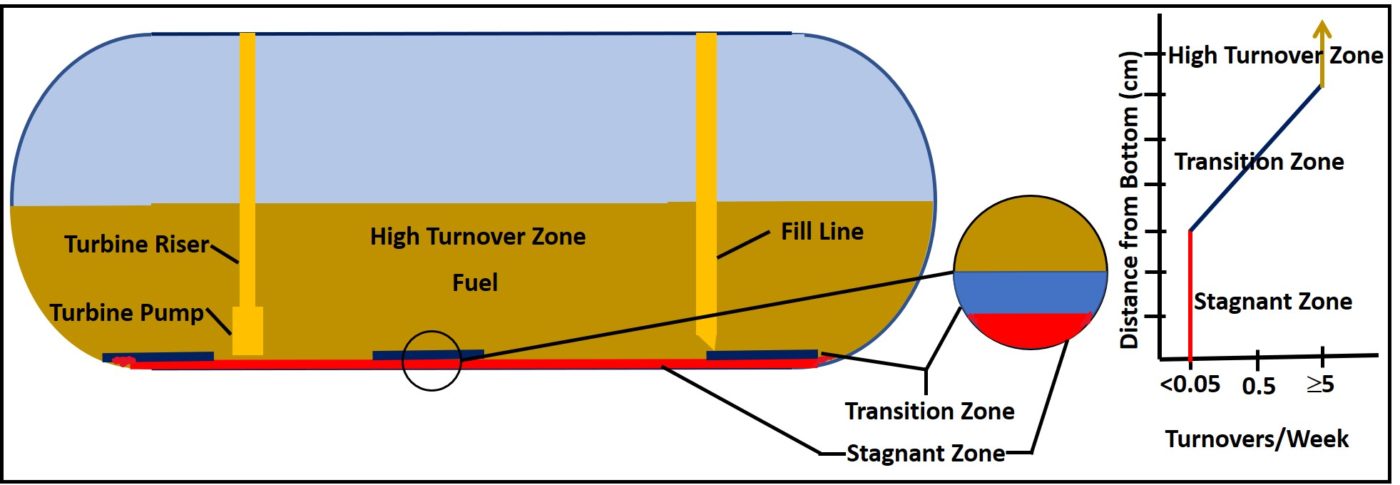
Fig 1. UST hydrodynamic zones. Bottom 2 cm to 5 cm are stagnant. In the overlying 2 cm to 5 cm, turnover rate increases with distance from bottom. Above the transition zone the turnover rate is approximately the same throughout the tank. In a retail UST, this can be ≥5 turnovers/week.
This underground storage tank (UST) receives at least five deliveries per week. Consequently, fuel turnover in most of the tank is ≥5x/week. In most tanks the bottom several cm are stagnant (outside fill line scour zones). At the bottom of this zone, free-water and particulates accumulate so that they will not be drawn into the submerged turbine pump (STP) with clean product. Between the high turnover and stagnant zones there’s a transition zone. At the interface between this zone and the stagnant zone, turnover rates are negligible (see graph in Figure 1). As the distance from the tank bottom, the turnover rate increases until it is nearly the same as the high turnover zone. The transition zone is typically 2 cm to 5 cm thick, depending on the distance of the suction line’s inlet from the tank bottom.
The stagnant bottom-zone – where free-water, sludge, and sediment accumulate – is one of the regions where heavy bioburdens are most likely to be found. This is true for nearly all fuel tanks. When the fuel turnover rate is faster than 1x/month, fuel properties are unlikely to be affected by bottom-zone bioburdens. Thus, microbial test results indicating the need for immediate corrective action won’t be reflected in the results of tests run to determine whether the fuel is in specification. The longer fuel is stored (for example in emergency generator system fuel tanks, where fuel can be stored for years), the more likely it is that microbial activity will affect the fuel’s properties.
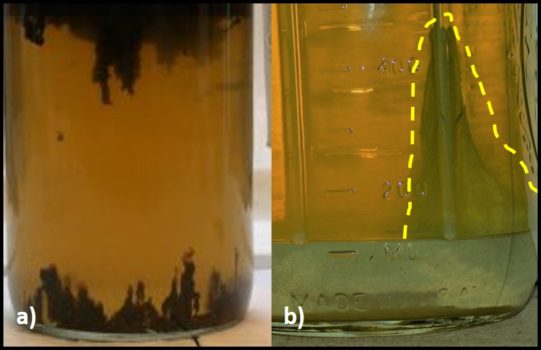
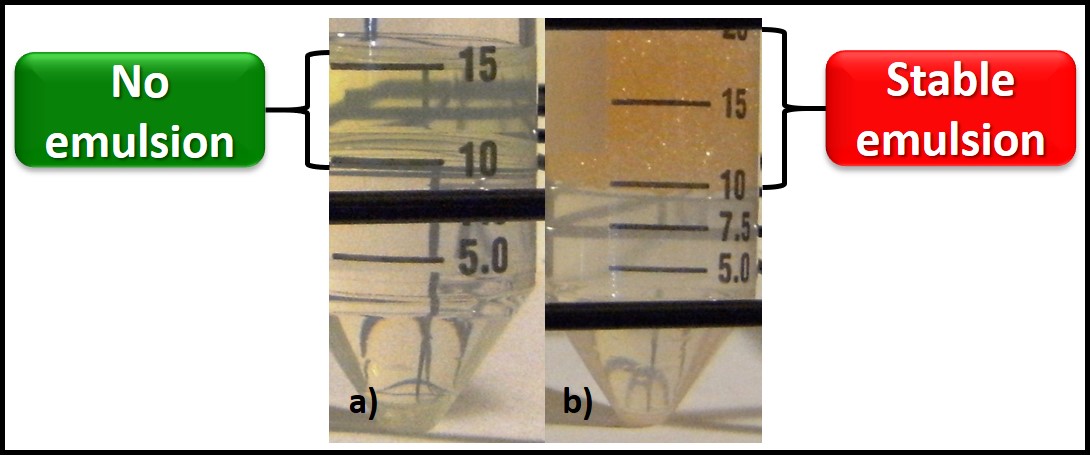
Notwithstanding the difficulty linking high bioburden results with fuel biodeterioration, bottom sample gross observations can be very helpful. Figure 2a shows a three-phase bottom sample. An invert emulsion zone (rag layer – fuel droplets dispersed in water) is most often a symptom of biodeterioration activity. When the rag layer adheres to the sample bottle’s surface (as in Figure 2b), you can be confident that the invert emulsion was caused by microbial activity. Microbes can produce detergent molecules called biosurfactants. Biosurfactant production can be tested quite easily. Place 5 mL of bottoms-water and 5 mL of fuel into a 50 mL polypropylene centrifuge tube and shake vigorously for 30 sec. Let the mixture stand for 15 min. If the phases separate cleanly, the results are negative (Figure 3a). If microbes have produced biosurfactant, a stable emulsion will form (Figure 3b).
The details
For more details about understanding the relationship between microbiology test data and fuel or fuel system biodeterioration, please contact me at either fredp@biodeterioration.control.com or 01 609.306.5250.
