FUEL & FUEL SYSTEM MICROBIOLOGY PART 11 –TEST METHODS – BOTTOM SAMPLE CHEMICAL TESTS
We are progressing from test methods that do not require any equipment (other the tools you need for sample collection) to those that require increasingly expensive tools. You can complete basic gross observations by relying on your eyes and nose. The physical tests I suggested in Part 10 require simple tools; including a magnetic stirring bar retriever, disposable syringes, filter pads and in-line filter holders. In this blog, I’ll discuss a couple of simple chemical tests. However, with one exception, the devices used to run these tests cost a few hundred dollars. This means that under most circumstances, I’ll be writing about tools that condition monitoring service teams, rather than individual site owners, should have on hand.
Water paste is the exception I was referring to above. I hope that if you are reading this blog, you are familiar with water paste and how to use it to detect bottoms-water. For readers who are unfamiliar with it, water paste is a thick substance that can be applied to the bottom of a sounding stick or gauge bob (fig 1). Note that if the gauging stick does not contact the tank’s actual bottom, water that’s present might go undetected.
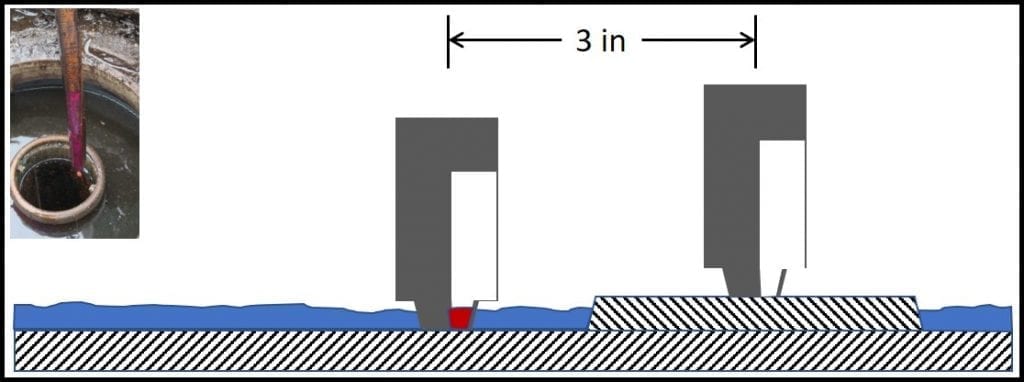
Fig 1. Using water paste to detect bottoms-water. Left inset: gauging stick with bottom 6 inches coated with paste. The paste had been white, but had turned purple after having been lowered to the tank bottom and removed. The purple color change indicated that there were at least 6 inches of bottoms-water in the tank. Many UST have strike-plates under the fill-line. In this schematic, the UST has 0.25 inches of water. Because the strike-plate is 0.5 inches thick, gauging fails to detect the water. Had the stick contacted the UST bottom, just beyond the strike plate, the paste would have shown that 0.25 inches of water were present.
Why do I list water-paste use as a chemical test? Because the color change is a chemical reaction. Also, if there isn’t any bottoms-water in your bottom sample, you cannot run either of the other two tests I’m covering in this post.
Point of nostalgic disclosure: the chemical tests that I am about to describe used to be more useful than they are now. Many fuel additives can move from fuel into water. This process is called partitioning. Let’s say that a particular additive is 100% soluble in fuel and 20% soluble in water. Whenever a fuel tank has any free-water, the additive will partition into the water until its concentration in the water is 20%. Keep in mind that in a UST with 7,000 gal of fuel and 70 gal of water (yes, that’s a lot of water!) the fuel to water ratio is 700 to 1. This means that even though the additive’s concentration is 20% in the bottoms-water, only an immeasurably small amount of the additive has partitioned out of the fuel. The fuel’s chemistry isn’t affected, but the water’s chemistry is. Let’s see how this affects pH and total dissolved solids (TDS).
pH measurement provides an indication of an aqueous solution’s acidity. pH ranges from 0 to 14; with pH = 7 being neutral, pH <7 being acidic, and pH >7 being alkaline. The lower a solution’s pH, the more acidic it is. For example, the pH of stomach acid is in the 1.5 to 3.5 range (it’s essentially hydrochloric acid). Conversely, the higher the pH of a fluid, the more alkaline it i(bleach’s pH = 12). Historically, bottoms-water pH <6 was a good indicator of microbiological activity (microbes produce a variety of acids). Although pH <6 still suggests microbiological activity, some fuel additives act as buffers – they prevent pH change. Fig 2 illustrates the difference between adding acid to unbuffered water and adding it to buffered water. The pH eventually falls in both cases, but when buffer is present, it takes substantially more acid to get to the same pH. This means that in today’s fuel systems, pH drop is a later problem indicator than it was in the days before there were as many additives that partitioned into the water.
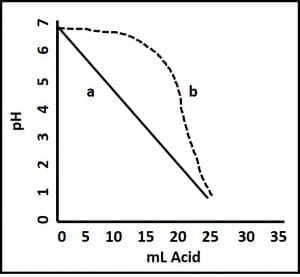
Fig 2. Buffer effect. Acid is added to two aqueous fluids; both with pH = 6.8. Fluid a is unbuffered. There is a straight-line relationship between the volume of acid added to the sample and its pH. Fluid b is buffered. Its pH does not begin to change appreciably until after 12 mL of acid have been added.
The easiest way to measure bottoms-water pH is to use pH paper (available from scientific supply distributors). Transfer a few mL of bottoms-water into a clean test tube or other small container. Dip a pH test strip into the water. After a few seconds, compare the color on the test strip against the color comparison chart provided with the test strips (fig 3). Generally, it’s sufficient to use tests trips that give whole pH unit results (fig 3a). If you want more precision, you can run a second test using pH paper that detects 0.2 pH differences (fig 3b). Digital pH meters (fig 3c) are generally more precise (reading to 0.01 pH units) than indicator strips. However, meters are more expensive than disposable test strips. Additionally, if meters are not kept clean and calibrated, they can give you precise, but inaccurate results.
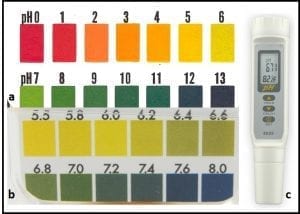
Fig 3. pH test kits: a) broad range (pH 0 to 13), pH test strips with 1 pH unit precision; b) narrow range pH test strips with 0.2 pH unit precision; c) hand-held pH meter.
The final chemical test I’ll discuss today is TDS. As the name implies, TDS include all dissolved chemicals (organic and inorganic) in bottoms-water. Before the late 1990’s, typical gasoline bottoms-water TDS were in the 150 mg L-1 to 250 mg L-1 range and diesel fuel bottoms-water TDS were in the 250 mg L-1 to 500 mg L-1 range. High TDS concentrations would signal the presence of dissolved metals (corrosion byproducts), microbes and their metabolites, or both. However, the increased use of fuel additives that can partition into the water has translated into TDS >2g L-1 in both gasoline and diesel fuel bottoms-water. This high background TDS concentration can mask the contribution of microbes and corrosion to the total. There is a work-around, but the details are beyond the scope of this blog post.
TDS can be measured by weighing the residue that’s left behind after the fluid has evaporated away. However, TDS is directly related to conductivity (the ability of a material to carry an electrical current). The easiest way to measure TDS is to use a handheld meter (fig 4). Most meters offer the option of showing either conductivity (µS cm-1) or TDS (mg L-1).
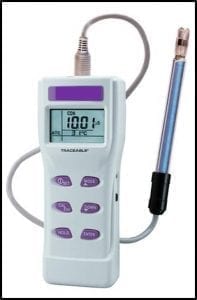
Fig 4. Conductivity meter.
If you collected a good sample, by the time you have collected water level, pH, and TDS data, you know quite a bit about the condition of the fluids in your tank. You are at the “if it walks like a duck and quacks like a duck…” point of your field testing effort. You should be 90% certain of whether you have uncontrolled microbiological contamination (MC) in your system. Final confirmation depends on microbiological test results. I’ll begin to discuss these in my next post. Of course, if you want to learn more now, please send me an email at fredp@biodeterioration-control.com.