RETAIL AND COMMERICAL FUEL SYSTEM CLEANLINESS – VALUE PROPOSITION ONE MORE TIME
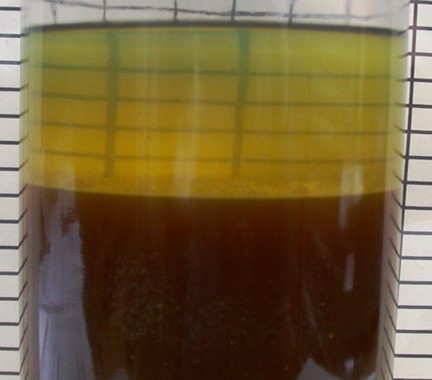
Bottom sample from ultra-low-sulfur diesel tank showing hazy fuel over bottoms-water loaded with suspended solids.
Opportunity Cost
In two previous articles, I’ve discussed the opportunity costs associated with premature filter plugging (see November 2016 and February 2019). My November 2016 article focused on the disconnect between operator awareness and the actual incidence of substantial contamination in underground storage tanks (UST) and fuel transfer equipment between UST and dispensers. In February 2019, I presented an opportunity cost calculation model that I had first suggested to fuel retailers in 1992. My 2019 calculations were based on unleaded gasoline sold at $2.30 U.S. per gal. Today, as I passed several forecourts gasoline prices ranged from $2.60 to $2.80 per gal and ultra-low-sulfur diesel (ULSD) prices were more than $6.00 U.S. per gal. In my February 2019 article I defined opportunity cost as follows (note: the maximum permitted flow rate at commercial dispensers is 40 gpm):
Opportunity cost is the difference between the economic value of the theoretically optimal use of an assist and the value realized by its actual use. At fuel retail sites that experience rush hour peaks, where the dispenser flowrate is the primary factor controlling fuel sales revenues, the opportunity cost is the difference between sales generated while dispensing at 10 gpm (U.S. EPA’s maximum permissible flowrate at retail dispensers) and sales generated while dispensing at slower flowrates.
If you assume that dispensers can operate for a maximum of 30 min per hour – allowing 30 min per hour for payment and vehicle movement), a commercial dispenser can deliver 1,200 gph. At $6.00 gal-1 , that generates $7,200 gross revenue. For each 1 % of flow rate reduction, the opportunity cost is $72 h-1 . That doesn’t seem like much but, if flow rate is the limiting factor for 4h day-1 , the opportunity cost per dispenser per year is $105,000 for each 1 % of flow rate below the 40 gpm maximum.
Case Study
Since I first started providing fuel retailers with my opportunity cost model in 1992, few have been willing to check their flow rates and test my calculations. However, my cost model was validated in an article the that appeared in the 3rd quarter issue of PEI Journal (Vol 16, Issue 3). The title of the article was Preventing Fuel Contamination Issues by Bill Jones and Jessica Montgomery of Warren Rogers and Clean Fuels National, respectively. The article is a case study that illustrated the impact of maintaining clean fuel systems on opportunity cost.
Predictive Maintenance
In their PEI article, Jones and Montgomery advocated for a predictive maintenance approach (see What’s New December 2016, and January 2017), using flow rate testing as a fast and easily performed routine check. As shown in Figure 1a, five-weeks after new filters were installed, flow rates began to decrease. Jones and Montgomery noted that it is important to run flow rate tests during quiet periods. At sites with submerged turbine pumps (STP) that were under-capacity, flow rates were affected by the number of dispensers operating simultaneously (Figure 1b). At this site, flow rate testing at each dispenser needed to be performed when no other dispensers were operating.
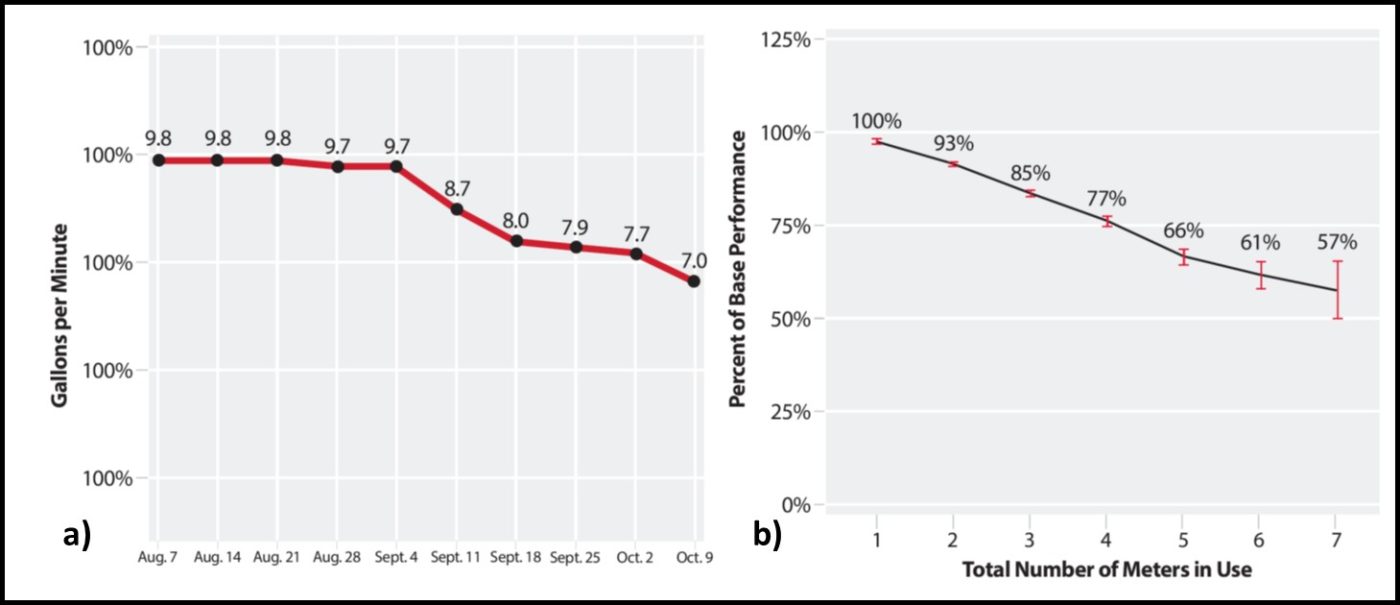
Fig 1. Retail gasoline dispenser flow rate testing – a) flow rate as a function of time in service since last filter change; b) flow rate as a function of the number of dispensers operating simultaneously (from Jones and Montgomery, PEI Journal, 16(3): pp 26-32).
Corrective Action Impact
Jones and Montgomery reported the impact of contaminant removal (UST system cleaning) on daily fuel sales volumes (Figure 2 – Figure 1-4 in the PEI article). The figure did not identify which dispensers handled unleaded gasoline and which handled ULSD. Nor did Jones and Montgomery report the impact of tank cleaning on the time lapse between new filter replacement and flow rate degradation. I always recommend recording dispenser totalizer readings when changing filters. Premature filter plugging (e.g., flow-rate reduction) relates to how many gallons have been filtered before flow rate (or pressure differential) is affected. When the fuel is clean, a 10 µm dispenser filter should be able to process at least 500,000 gal before the flow rate decreases by 10 %. In the case of dispensers H18 and H19 – each delivering approximately 4,000 GPD – that translates to approximately 4 months (125 days) of at least 90 % maximum flow rate. For the lower volume dispensers (H9, H10, H11, H12, and H17) that handled approximately 200 GPD, filter performance life should be years. Here, I’ll focus on the impact of tank cleaning on dispenser H18T to illustrate the opportunity cost associated with premature filter plugging. After tank cleaning and fuel polishing:
- Average daily sales increased by approximately 2,400 gallons.
- If the product was ULSD @ $6 gal-1 , after cleaning, H18 generated an additional $14,400 gross revenue per day, or $5.3 million per year.
- If the product was regular unleaded gasoline @ $4 gal-1 , after cleaning, H18 generated an additional $9,600 gross revenue per day, or $3.5 million per year.
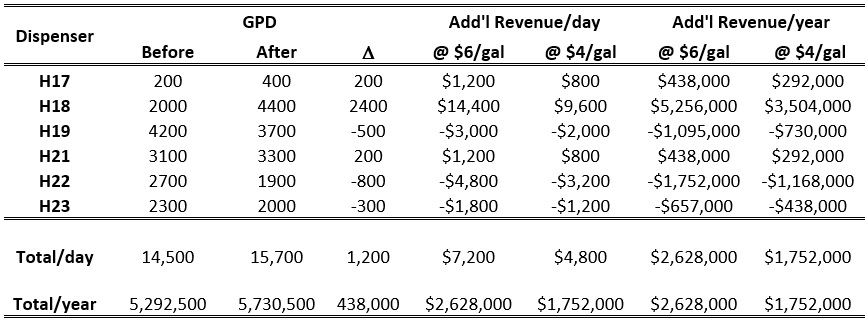
Table 1 summarizes the net additional revenue for all the dispensers at which substantial fuel sales volumes were observed. Although sales at several dispensers decreased (the article made no mention of other contributing factors), the net increase was 1,200 GPD (438,000 gal per year). I used current fuel pricing here in the Princeton New Jersey area to compute the sales $s impact.
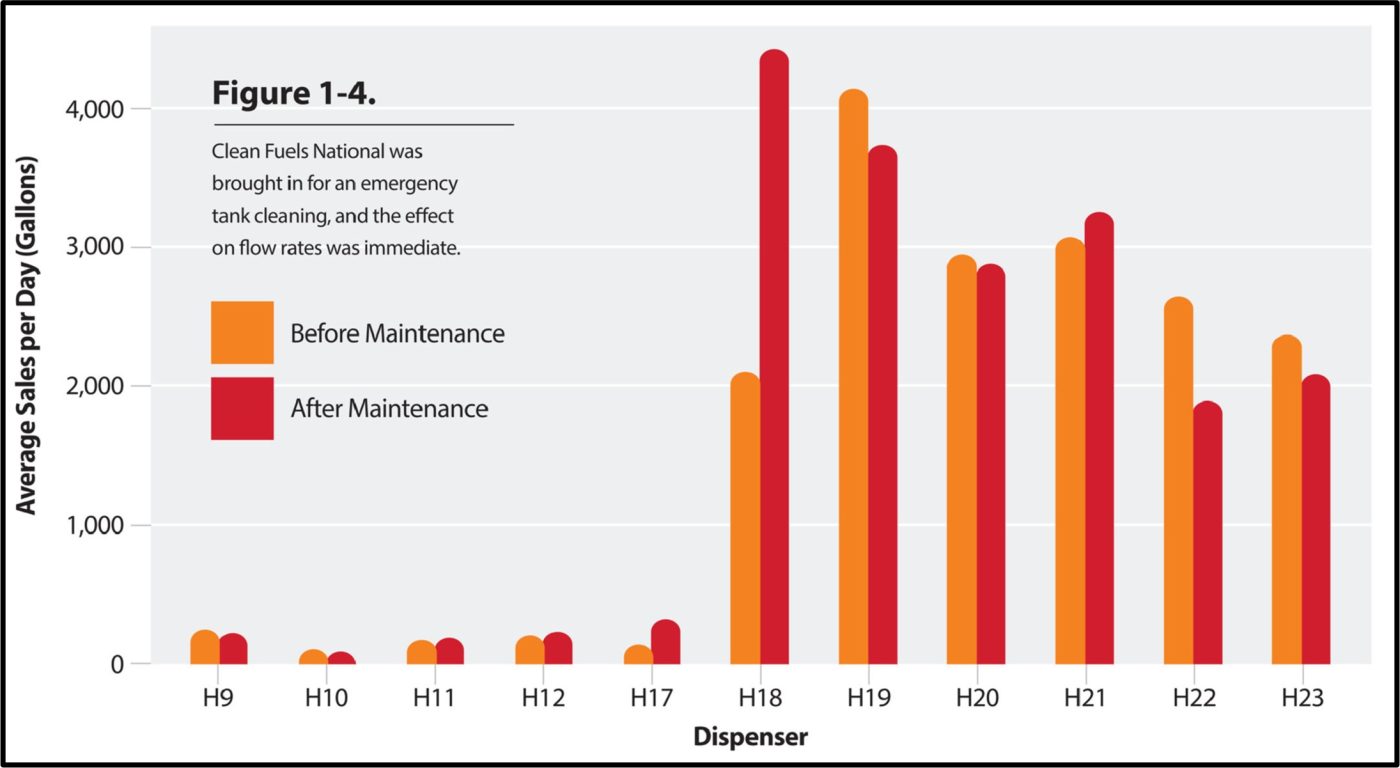
Fig 2. Effect of tank cleaning on fuel sales volumes (from Jones and Montgomery, PEI Journal, 16(3): pp 26-32).
Table 1. Effect of tank cleaning on revenues (data taken from Figure 2).
Bottom Line
In 1992, when I founded BCA, I shared an opportunity cost calculation tool with prospective fuel retailer clients. Thirty years later, a case study reported in PEI Journal validated the opportunity costs estimated in my model.
There are factors other than filter plugging that affect dispenser flow rates. The most common is pump power insufficient to deliver maximum permissible flow to all dispensers when customers are fueling at multiple dispensers. In my March 2021 What’s New post, I summarized other common causes of fuel system flow rate reduction.
There are factors other than uncontrolled microbial contamination that contribute to premature (i.e., >10 % flow rate reduction before 500,000 gal have been filtered) filter failure. However, uncontrolled microbial contamination is one of the most common causes.
Cost effective condition monitoring relies on tiered testing (see What’s New, February 2017) in which a fast, easily performed test is run most frequently and more diagnostic tests are run when the results from the frequently run test are at or above their control limit (see What’s New, October 2020). The Jones and Montgomery case study article published in PEI Journal (Volume 16, Issue 3, 2022) demonstrates the value of both tiered condition monitoring and linking test results to appropriate actions.
For more information about fuel system condition monitoring and predictive maintenance, contact me at fredp@biodeterioration-control.com.
