WHAT IS QUANTITATIVE RECOVERY?
Most commonly, quantitative recovery applies when a method consistently detects a substantial percentage of the intended analyte in a specimen. Read on to learn more.
Analytes and Parameters
In chemistry, an analyte is a substance or material being measured by an analytical method. In microbiology, the analyte is either microbial cells or molecules. A parameter is a property used to quantify an analyte. Direct counting – using either a microscope or a flow cytometer – is the only microbiological test method for which the analyte and parameter are the same – cells. More commonly, the parameter measured is something that is proportional to the number of cells present. For example, with culture testing (see What’s New 06 July 2017) the analyte is culturable microbes and the test parameter is colony forming units (CFU – Figure 1a). For adenosine triphosphate (ATP) testing the analyte is the ATP molecule and the parameter is light emitted during the luciferase-luciferin mediated dephosphorylation of ATP to adenosine monophosphate (AMP – see What’s New, August 2017 and Figure 1b).
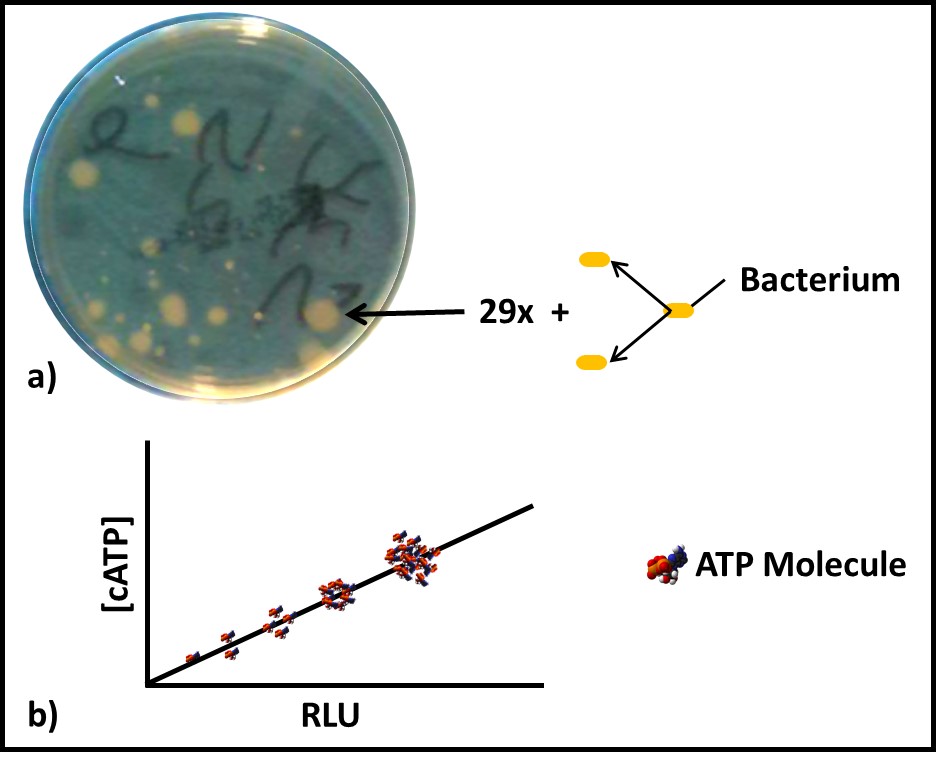
Fig 1. Two microbiological analytes – a) Colony counts – the analyte is the original, culturable bacterium. To be detectable, the microbe must reproduce through approximately 30 generations (doublings) to produce a visible colony. The number of colonies on a plate are reported as colony forming units (CFU). The CFU/plate are corrected the degree to which the original specimen was diluted (i.e., the dilution factor) to give a result in CFU mL-1, CFU cm-2, or CFU g-1. b) Adenosine triphosphate (ATP) concentration – the chemical interaction of ATP with the substrate-enzyme reagent luciferin-luciferase generates a photon of light – generally observed as an instrument-dependent relative light unit (RLU). Quantitative results are obtained by comparing observed test results with those obtained using one or more ATP reference standards.
Quantitative Recovery does not mean 100 % Recovery
Microbiological testing includes several steps between sample collection and result recovery. In my January 2022 What’s New article, I’ll provide a more complete discussion of how each of these steps contributes to test result variability. For now, it is sufficient to understand that recovery is a source of variation.
Figure 2 is similar to, but slightly different from Figure 7 in my March 2020 article. Each of the methods illustrated is quantitative. However, except for direct counts (possibly), none captures 100 % of the analyte.
Analyte recovery is affected by one or more factors. All methods are affected by analyte heterogeneity – non-uniform distribution of microbes (Figure 3). Regardless of the method used, if the number of microbes present (bioburden) in replicate samples varies substantially, then so will the results. Bioburdens tend to be distributed more homogeneously in low viscosity (<20 cSt) aqueous fluids (e.g., cooling tower water, water-miscible metalworking fluids, liquid household products, etc.) and more heterogeneously in viscous, water-based fluids or in non-aqueous fluids (e.g., fuels, lubricants, and oils).
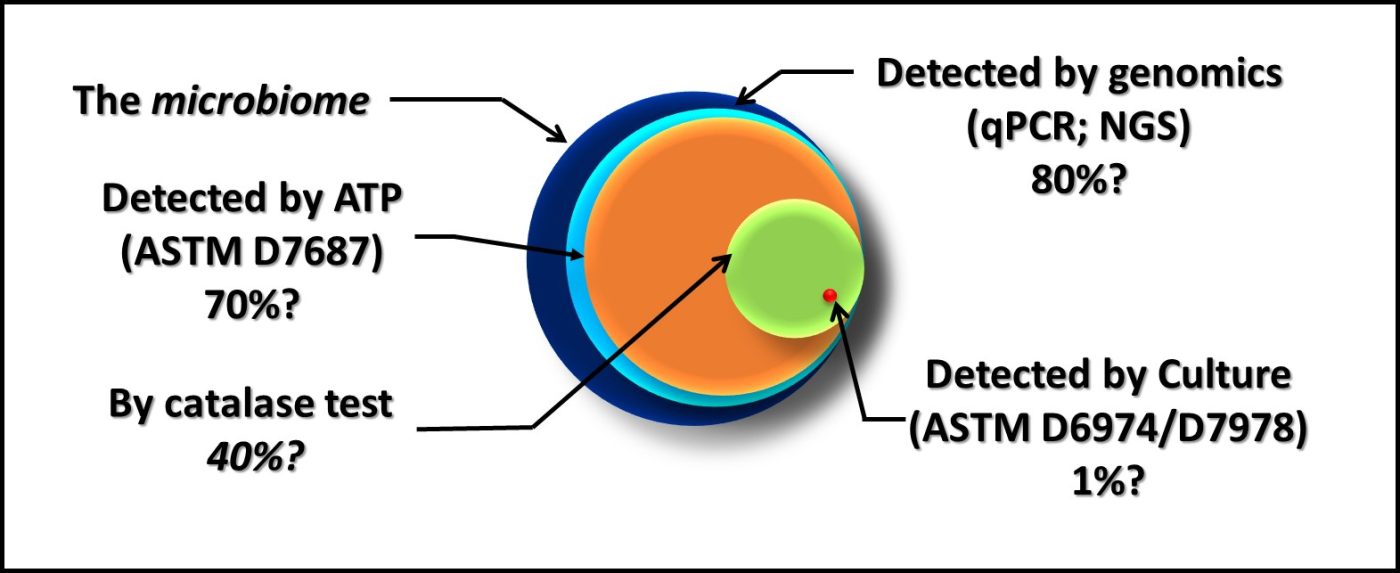
Fig 2. The dark blue circle represents all microbes present in a sample – the microbiome. The percentages listed under each method are estimates of how much of the microbiome it detects.
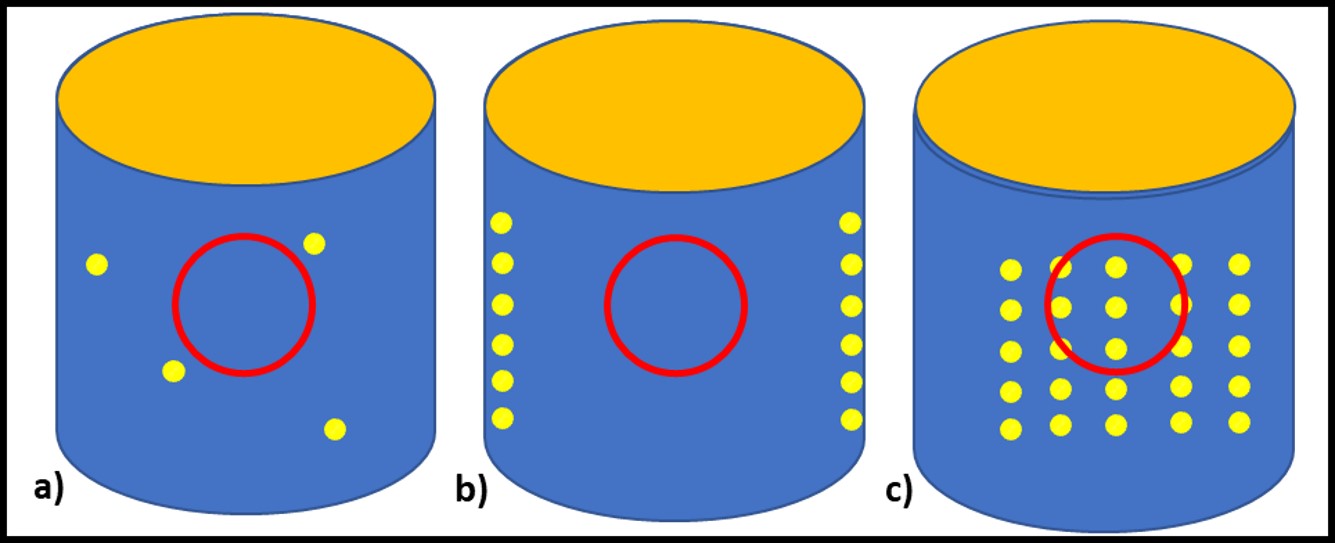
Fig 3. Impact of heterogeneity on analyte in samples – a) sample misses widely dispersed microbial masses; b) sample missed uniformly distributed on system surfaces but not in fluid; c) sample captures representative biomass from uniformly distributed masses.
Similarly, all methods are affected by specimen handling. Recall that a specimen is the portion of a sample that is analyzed. Thus, one or more 20 mL specimens from a 500 mL sample might be tested by ASTM method D7687 for ATP in fuel. In ASTM method D7687 and practice D6974 a filtration step is used to physically separate microbial cells from the specimen (Figure 4). For ATP or genomic testing, the cells are then broken open (lysed) to release their contents (e.g., ATP, DNA, RNA). For culture testing the membrane is placed onto a nutrient medium.
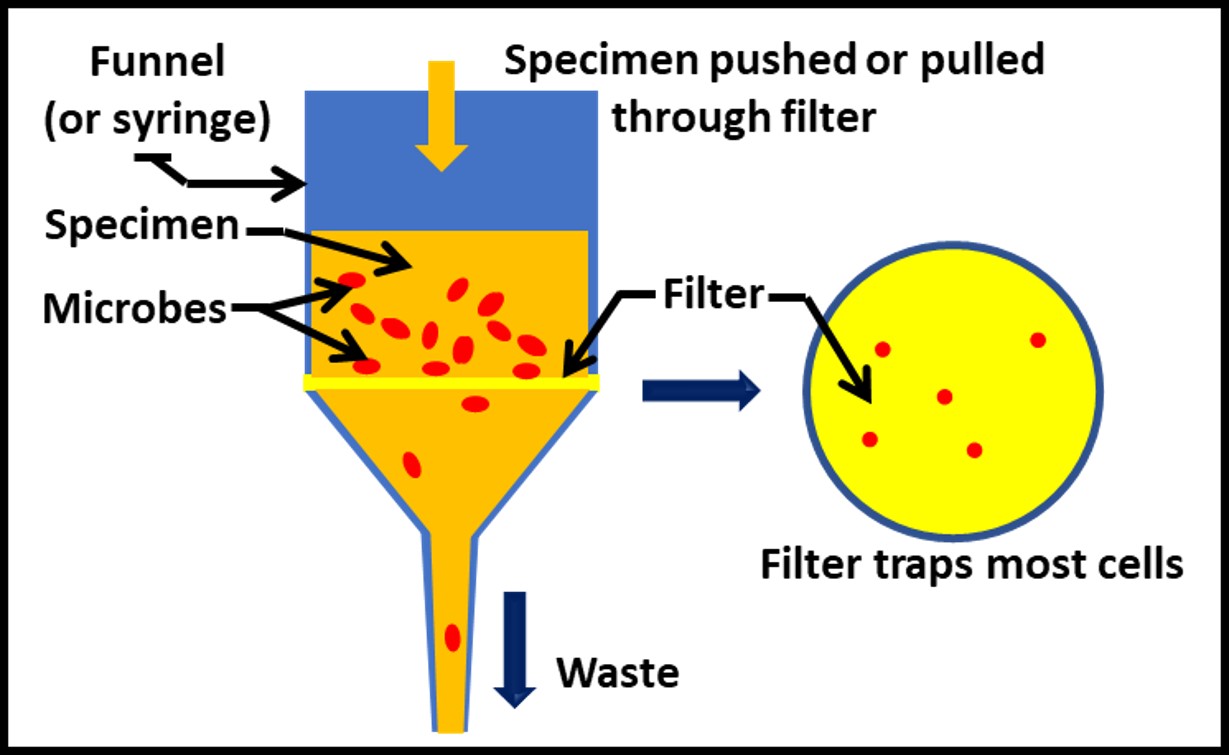
Fig 4. Separating microbes from a specimen – filtration method.
The filters’ nominal pore sizes (NPS) are 0.45 µm for D6974 and 0.7 µm for D7687. Both are larger than the 0.22 µm NPS filters used for filter sterilization. However, each has proven adequate to quantitatively retain bacterial cells in specimens to be analyzed by the respective test method.
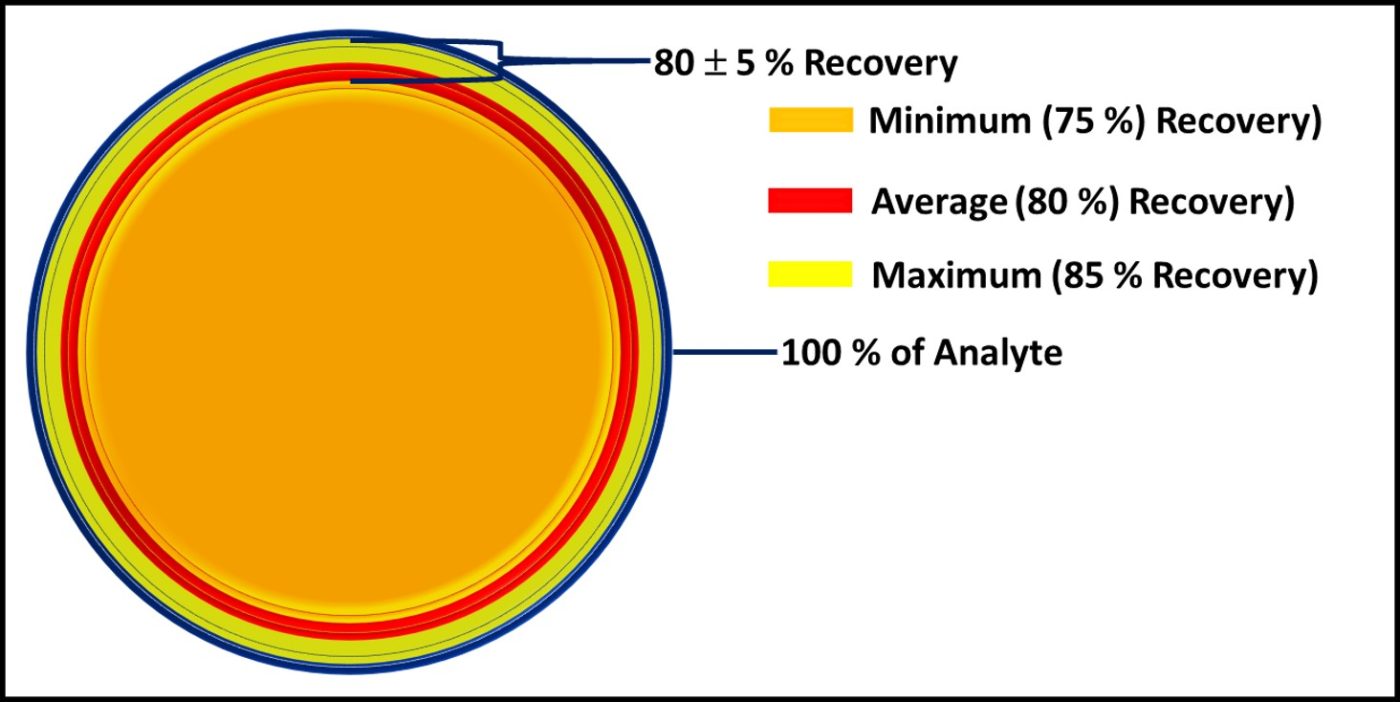
Put another way, the filters used for D6974 and D7687 meet the objective – to ensure that the percent recovery will always be within an acceptable range. Figure 5 illustrates this concept for D7687. When both the specimen and filtrate are tested for cellular ATP concentration ([cATP]), the [cATP]filtrate = 0 % to 10 % of the ATP-bioburden intentionally added to the specimen. This range was determined through a series of field tests that were run to determine the precent recovery of ATP from fuel samples. The average percent recovery ± standard deviation was 101 ± 10 % (where the samples were spiked with bacteria to give 2,000 pg mL-1).
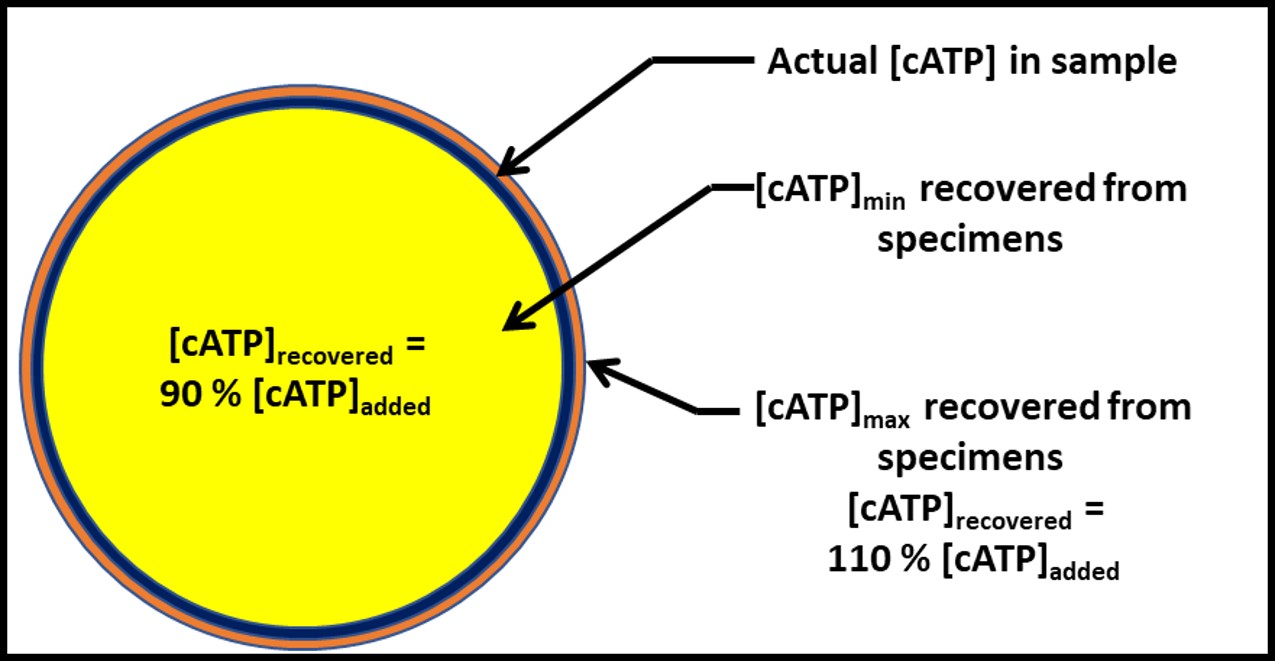
Fig 5. Cellular ATP (cATP) recovery = 90 % to 110 % of the analyte in typical specimens. Note that the blue circle’s area that is not covered by the yellow circle and the orange circle’s area that is not covered by the blue circle are negligible.
What This Means in Practical Terms
I wrote this What’s New article because someone using ASTM D7687 performed a culture test of the filtrate and recover 105 CFU mL-1. They did not test the filtrate for [cATP]. Consequently, they were alarmed that the filter used for ASTM D7687 did not trap microbes quantitatively.
If the culturable bioburden before filtration was 1 x 10⁶ CFU mL-1, and 10 % of the cells passed through the filter, the culturable bioburden in the filtrate would be 1 x 10⁵ CFU mL-1. It would be naïve to conclude that the filter did not trap bacterial cells very efficiently. The percentage of cells that passed through the filter was a small fraction of the total number of cells in the specimen. Consequently, the loss would not affect how the test result was interpreted (see What’s New, August 2021). Keep in mind that for D7687 and D6974, respectively the typical test result standard deviations are Log10 X ± 0.1X and Log10 Y ± 0.5Y, where X is [cATP] in pg mL-1 and Y is CFU mL-1.
There is a common impulse to compare test results obtained from different test methods that measure different parameters. However, as explained in ASTM Guide E1326, it is essential to fully understand what is actually being compared. When testing quantitative recovery, it is imperative to use the same analyte before and after the microbe separation step illustrated in Figure 3.
As always, I look forward to receiving your questions and comments at fredp@biodeterioration-control.com.
