Archive for March, 2017


FUEL & FUEL SYSTEM MICROBIOLOGY PART 9 –TEST METHODS – BOTTOM SAMPLE GROSS OBSERVATIONS

Beginning with this post, I’m moving into Phase 3 of this series. In the first five posts, I introduced the issues that make fuel system microbiology condition monitoring important.  In Part 6 through 8 I covered the foundational concepts of sampling and testing.  Now it’s time to talk about actual test methods. The take home lesson here is that you can detect microbial contamination without having a lot of technical training or investing in expensive laboratory facilities.

Gross observations are tests that rely only on our senses.  We look at, sniff, and, perhaps, touch samples to determine whether they are likely to be heavily contaminated.   We begin by obtaining a useful sample.  If you are not sure what I mean by useful sample please read my 28 November 2016 blog post on sampling.

Bottom-sample gross observations work best if you collect the sample from the lowest point in the tank.  Underground storage tanks settle unpredictably.  The first-time a UST is filled, its 90,000lb weight compresses the backfill on which it rests.  Regardless of how well the backfill is prepared, some areas will be softer than others.  The UST will continue to compress the backfill for years.  This means that it is important to check its trim (angle at which the UST lies) annually.  To do this, stick the tank at three points: fill end, turbine end and automatic tank gauge ATG – (usually this will give your fuel levels at each end and the center).  The fuel level will be greatest at the UST’s low point.  Although most UST are installed to be low at the fill end, Murphy’s Law seems to dictate that much of the time, they settle by the turbine end.  Best design is to have an inspection port in the turbine well (figure 1). If find that the UST’s low point is at the turbine end but you can’t sample from that end routinely, sample from the ATG well.  Pulling the ATG will give you a chance to look at the ATG’s water float.  If it looks like figure 2, you most likely have a microbial contamination problem.

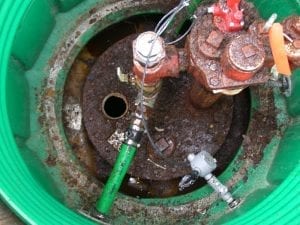
Figure 1. Turbine well showing 4in inspection port just left of center.

Figure 2. ATG water float covered with microbial contamination.

The two samples most likely to provide the best clues about a fuel system’s condition are bottom samples and components (filter, flow-control valve, automatic tank gauge float, etc.).  Let’s focus on bottom samples.  If you pull a sample from a tank’s lowest point, and get a sample that looks like figure 3, you can be fairly certain that you do not have a severe microbial contamination issue.  On the other hand, if your sample looks like the one in figure 4, there’s a >90% probability that the system is heavily contaminated.  Microbes produce chemicals that can emulsify fuel.  Hazy fuel or a third layer, between the water and fuel is a sure sign of microbial activity – particularly if the middle layer sticks to the side of the sample bottle as it does in figure 5.

Figure 3. UST bottom sample: there’s no water, and the fuel is clear and bright; water-white.

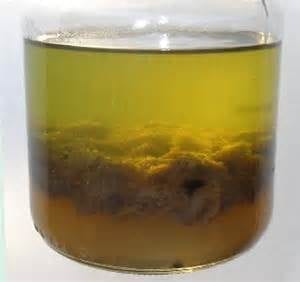
Figure 4. UST bottom sample; A thick rag (invert emulsion) layer separates the hazy fuel from the very turbid, bottoms-water.

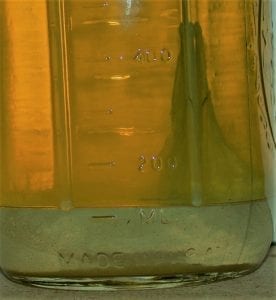
Figure 5. UST bottom sample: rag layer (looks like a hanging drape)
adheres to the sample bottle wall.

Quick, simple, gross observations provide reliable indications of uncontrolled microbial contamination.  If your eyes tell you the system is clean, then you don’t need to do any more microbiology testing.  If gross observations signal microbial contamination, the next step is to confirm what your eyes are telling you.  I’ve just scratched the surface in this blog.  If you’d like to learn more, please send me an email at fredp@biodeterioration-control.com.

FUEL & FUEL SYSTEM MICROBIOLOGY PART 8 – CHOOSING TEST METHODS B

STP spill containment well.  Good news: well has a 4 inch port for testing bottoms-water height and collecting bottoms samples.  Bad News: there is lots of corrosion.

The canary in the coal mine….

In my last post, I discussed the kinds of questions that should be asked before deciding on what tests to run and how frequently to run them.  Now I’ll share my condition monitoring (CM) philosophy with you. I’ll list them as axioms – statements that should seem obvious to the most casual of observers. 

Axiom 1: For most frequent testing, rely on methods that are easy to perform and interpret.  The flow-rate example that I shared in Part 7 (16 February 2017) illustrates this point.  You can test dispenser flow-rate while filling your vehicle.  The only test equipment you need is a stop watch, or flow-rate APP (I don’t want to be commercial here, but I know of at least one fuel system service company that offers a free, dispenser flow-rate APP). 

Axiom 2: The tests you run most frequently should be your canaries in the coal mine1.  I call these simple, frequently run tests 1st Tier tests.  They don’t tell you much about why there is a problem, but signal either that a problem exists, or that the risk of a problem developing has increased.  Examples of other 1st Tier tests include:

  • Bottoms-water detection, by water-paste on fuel gauging stick or sounding bob.
  • Standing water in spill containment wells.
  • Broken spill containment well covers.
  • Heavily corroded submerged turbine pump (STP), turbine distribution manifold (see photo above).

The common feature of these tests is that they require very little technical training or test equipment.

Axiom 3 (repeat from Part 7): Every parameter that you test must have control limits! You need to know what is normal and what isn’t.  I like the green, amber, and red light approach. 

  • When conditions are normal, you have a green light.
  • When conditions are not quite normal, but operations don’t seem to be affected, you are in the amber light zone. This is the time to run additional tests or schedule preventive/early corrective maintenance. This is the zone that links CM to predictive maintenance (PdM – see Part 5).
  • The red-light zone indicates that you are having problems. You need to schedule corrective maintenance as soon as possible. When your site has a well-planned, well executed CM program, you never get red zone test results. Red-light results signal both operational and PdM program problems.

Axiom 4: 1st Tier, amber-light results should trigger either maintenance actions or 2nd Tier tests.

  • Action example: if you detect water in a spill containment well or tank bottom, remove it. There’s no need for additional testing to help you determine the best course of action.
  • 2nd Tier testing example: If your dispenser flow-rate <80% of maximum, use 2nd Tier testing to determine why.  Remember: slow-flow is not the same as a plugged filter!  There are several chokepoints (for example: screens) between the STP and dispenser nozzle.  Moreover, slow-flow after a 500 000 gal of fuel have passed through a dispenser filter tells a much different story than slow-flow after 50 000 gal have been filtered (see the flow-rate testing example in Part 7).

Axiom 5: 2nd Tier tests should be diagnostic, but sufficiently easy to perform so that a trained technician can complete the testing on-site. In most cases, 2nd Tier test results provide sufficient information to guide maintenance actions.  I break 2nd Tier tests into four categories, and will discuss each category in more detail in the next four MICROBIAL DAMAGE blog posts. I list the categories here:

  • Gross observations
  • Physical tests
  • Chemical tests
  • Microbiological tests

There are rare occasions when the 2nd Tier test results are inconclusive.  Additional testing is needed to diagnose what’s going on.  In most cases, 3rd Tier tests are run at specialty testing labs.  These are labs that have particular expertise in fuel, corrosion, or microbiological testing.  Examples of 3rd Tier testing include:

  • Corrosion deposit analysis
  • Fuel property testing (this typically includes tests listed in ASTM fuel specifications)
  • Bottoms-water chemistry testing
  • Fuel or bottoms-water microbiology testing (detailed tests to determine the types of microbes present)

One very rare occasions, 4th Tier or 5th Tier tests are run to gain a deeper understanding of the processes that increase operational risks.  These higher tier tests are typically run as part of research efforts rather than in direct support of troubleshooting.  There is still quite a bit that we do not know about what causes fuel quality problems and fuel system failures.

As I have noted in previous posts in this series, in each post, I’m peeling back another layer of a complex onion.  If you are impatient and want to learn more now, don’t hesitate to contact me at fredp@biodeterioraiton-control.com. 

1 In the days before electronic oxygen and explosive gas detectors, miners would use canaries as hazard alarms.  If methane or carbon dioxide concentrations became too high, the canaries would die.  The canaries’ sudden silence would alert miners that they needed to evacuate the mine – high methane meant high explosion risk! (more…)

OUR SERVICES

  • Consulting Services
  • Condition Monitoring
  • Microbial Audits
  • Training and Education
  • Biocide Market Opportunity Analysis
  • Antimicrobial Pesticide Selection

REQUEST INFORMATION


    captcha