FUEL & FUEL SYSTEM MICROBIOLOGY PART 34 – Connecting the Dots, Part 2
Refresher from Part 1: What do Microbiology Test Results Mean?
In January’s Fuel & Fuel System Microbiology article I led with this question and commented that it is actually a double question. In one sense, it is asking: “Do my microbiology test results tell me conclusively whether microbes are damaging my fuel or fuel system?” In another sense, the question means: “Why don’t the results from different fuel microbiology test kits always agree?” I am then asked why often, even when microbiological test data indicate that there is heavy biocontamination present, the fuel does not seem to be affected. In today’s post – the second of three on this topic – I’ll discuss the relationship between microbiological test results and system damage.
Do My Microbiology Test Results Tell Me Conclusively Whether Microbes are Damaging My Fuel System?”
As I wrote, last month, the short answer is no. Keep in mind, all three of these posts about whether detected microbial contamination invariably signals biodeterioration is happening. This is different from the situation in which there are numerous indications of system biodeterioration, but microbiological test results are negative. I’ll revisit that issue in a future post.
Fuel System Biodeterioration
Biodeterioration is any damage caused by organisms. In fuel systems, the most common forms of biodeterioration are biofouling and microbiologically influence corrosion (MIC).
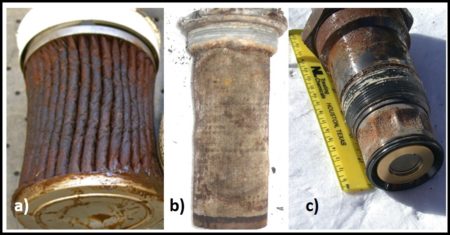
Biofouling is the result of microbes and the slime they produce (i.e., extracellular polymeric substance – EPS – the primary material in biofilms (see Part 15 for a refresher on biofilms) accumulating on system surfaces. When biomass accumulates on filters or screens, it restricts product flow. Figure 1 shows photographs of a dispenser filter, dispenser strainer, and leak detector strainer – each of which has become fouled with biomass.
Biofouling can also cause other problems including valves sticking or failing to close completely. When biofouling accumulates on the surface of an automatic tank gauge’s (ATG’s) water float (Figure 2a) the impact will depend on the biofilm. If the biofilm is filled with gas pockets, the float will be lighter than normal and will float within the fuel – giving a false signal that bottoms-water is present when it is not (Figure 2b). Conversely if the EPS is loaded with rust particles, the water float will be heavier than normal. It will rest on the tank bottom, even when 2 cm to 3 cm bottoms-water as accumulated (Figure 2c)
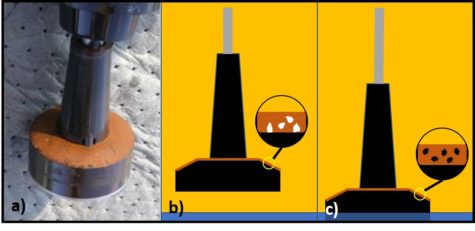
Biofilms coating vehicle fuel gauges will cause the gauges to give inaccurate readings.
Note that all of these biofilm accumulation zones are on system components. Fuel systems can have substantial bioburdens in tank bottom samples, but no biofouling. Although the possibility of fouling increases with increased bioburden in fuel tank bottom samples, detection of substantial microbial loads in fluid samples doesn’t necessarily mean that fouling has occurred. The only way to know for certain whether biofouling has occurred is by direct inspection of the fuel system components that are likely to become fouled.
Microbiologically influenced corrosion (MIC) includes any from of material damage that is caused either directly or indirectly by microbes. Most commonly, MIC is related to metallic components, but polymeric materials are also susceptible to MIC.
Contamination Detection
Connie Francis recorded Where the Boys Are as the title track for the 1961 movie of the same name. The next several paragraphs could be titled Where the Microbes Are. Microbial contamination is not a fuel property. Unlike fuel properties, the distribution of microbes in fuel systems is non-uniform (heterogeneous). The heterogeneous distribution of microbial contamination makes it difficult to collect a sample that is guaranteed to contain microbes – even if microbial contamination is present in the fuel system.
In my fuel microbiology courses I recount a lecture I heard as an undergraduate. My professor was part of the team tasked with developing a reliable test method for determining whether there was life on Mars. One member of the team suggested using a camera that would scan the horizon for signs of life. The device would scan 15 ° of arc at a time, completing a 360 ° scan each hour. The counterargument – illustrated in figure 3 – was that large life forms (elephants in figure 3) might be present but missed entirely because they continually moved out of the camera’s line of sight.
 Fig 3. Not detecting the elephants – a) elephants are to the east while camera is pointing west; b) elephants are to the west while camera is pointing east. A researcher viewing the camera’s photo record would conclude that there are no elephants in the area photographed!
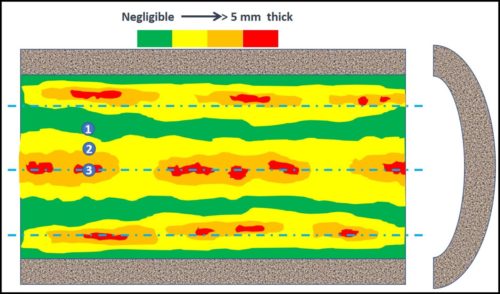
Now consider a 0.5 L (0.13 gal) sample collected from the bottom of a 38,000 (38 m3, 10,000 gal) tank. The sample represents 0.001 % of the total liquid volume in the tank. Similarly, a bottom sample from the bottom of a tank with a 31 m2 (31,000 cm2, 334 ft2) surface area draws in fluid, sludge, and sediment form a 3 cm to 5 cm radius. That represents 0.02 % of the total bottom surface area. Figure 4 illustrates how a two bottoms samples, taken from spots just a few cm apart, can have substantially different bioburdens.
Bottom Line
Fuel system samples used for microbiological testing are meant to be diagnostic – not representative. To be reliably diagnostic, samples must come from locations most likely to harbor microbes. This is can be impractical (if not impossible). Consequently, samples from systems with substantial fouling, MIC, or both can have negligible detectable bioburdens. Conversely, it is not uncommon for systems from which samples have apparently heavy bioburdens to have no biodeterioration symptoms. In Connecting the Dots – Part 3, I’ll write about why test results from different microbiology methods can lead to different conclusions. As I was writing today’s blog I decided to add a Part 4 – the impact of specific microbial activities on the link between bioburden and biodeterioration.
The details
For more details about understanding the relationship between microbiology test data and fuel or fuel system biodeterioration, please contact me at either fredp@biodeterioration.control.com or 01 609.306.5250.
