DORMANT MICROBES IN METALWORKING AND OTHER INDUSTRIAL FLUIDS

John Cleese and Michael Palin of Monty Python’s Flying Circus in the “Dead Parrot Sketch”, first aired in December 1969.
I today’s post, I’m returning to a topic I first discussed in 2019 (https://biodeterioration-control.com/2019/07/). In the Monty Python’s Flying Circus “Dead Parrot Sketch”, John Cleese plays the role of an unhappy customer who believes that he has just purchased a dead parrot. Michael Palin – playing the shopkeeper – insists that the parrot is not dead. Rather, it is “simply napping.”
When we monitor microbial contamination in industrial systems, we are typically interested in both how much microbial contamination is present and what damage risk the population poses to the system and the fluids it contains.
Last week, I received an email from a metalworking fluid (MWF) manager who wrote: ““We have another situation with dormant bacteria. In this case we find we have to keep hitting it with biocide more and more often. When the bacteria do start to grow again as the biocide level drops, we see huge pH, alkalinity drops within a week and there is often a bad smell associated. I worry that this is partially due to a large population of dormant bacteria (104 CFU mL-1 to 105 CFU mL-1 on paddles) that is able to wake up and grow more quickly. Is there a way to get at these bacteria and kill them to reduce their population?”
With the MWF manager’s approval, today’s article draws heavily on my response to his email.
Dormant cells
Bacterial endospores
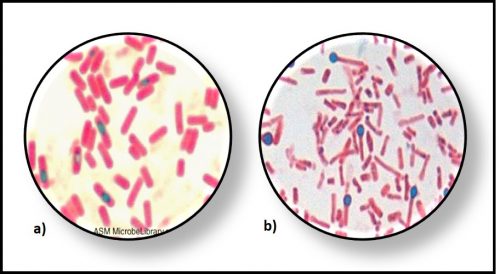
Endospores are special structures formed by a few types of bacteria. Endospores are metabolically inactive (i.e., dormant). There have been reports of microbiologists inducing endospores that have been dormant for more than a million years to germinate into vegetative (i.e., metabolically active) cells. Until recently (i.e., the past ~ 15 years), microbiologists believed that only endospore-forming microbes like Bacillus sp. (Gram +, spore-forming aerobic rods) and Clostridium sp. (Gram +, spore-forming anaerobic rods), could survive for long periods in a dormant – metabolically inactive state (Figure 1).
Persister Cells
In the late 1980s, microbiologists started to report on the existence of persister cells – non-sporeformers that seemed to be able to withstand biocide treatment. In some respects, persister cells are like trees that are dormant during the winter but become active as spring arrives. When conditions are unfavorable, these cells become metabolically inactive and can remain in this state for thousands of years. Unlike endospore-forming bacteria, persister cells do not form any special structures.
Understanding of persister cells grew as biofilm research advanced. It turned out that persister cells were often resistant to biocide treatment because they were metabolically inactive – much like endospores but without the unique endospore cell wall chemistry. Thus, the study of persister cells evolved into the study of dormant cells. Thus, the terms persister and dormant are used to describe cells that can become metabolically during tough times and then become active after prolonged periods (1,000s of years) of inactivity. The biology of dormancy and reactivation is still a hot research topic.
Viable but not culturable (VBNC) cells
The rapid development of non-culture microbiological test methods, starting with protein concentration testing in the 1940s, ATP testing in the 1950s, and rudimentary genomic testing in the 1970s (my lab used to test seawater samples for total DNA concentration among other microbiological parameters), led to an awareness that not all microbes were readily detected by culture methods. In 1982, a ground-breaking study focused on a disconnect between the incidence of cholera disease among Chesapeake Bay area restaurant patrons and the inability of the local Department of Public Health to recover the bacterium Vibrio cholera form suspect oyster meat. A post-doctoral fellow at the University of Maryland decided to compare microscope direct counts with culture data. He came of with the idea of treating specimens with a reagent that prevented cell division but permitted cell growth. Metabolically active V. cholera cells would show up as >10x their normal size. Dormant and moribund cells would be visible as normal sized cells. Low and behold, shellfish samples that yielded no culturable V. cholera actually had 106 to 109 metabolically active – i.e., quite viable cells mL-1! That work precipitated an avalanche of research on VBNC microbes.
The term VBNC includes two distinct categories of microbes.
Injured cells – The first category includes cells like the aforementioned V. cholerae that sometimes can be cultured but not reliably. These normally culturable cells are unable to reproduce on or in the growth medium that was designed to detect them if they are injured. Since the early 1980s, process steps have been added to culture test to help injured cells recover before they are cultured for enumeration.
Most types of bacteria – The second category includes microbe we do not yet know how to culture. They do not product colonies on any of the available growth media, under commonly used growth conditions (i.e., temperature, oxygen availability, etc.). Current estimates suggest that for every organism that has been successfully cultured, 1 million to 1 billion that exist in nature have not been cultured.
Metalworking Fluid Microbial Contamination Condition Monitoring
Choosing one or more test methods
If you test a population of people for height and weight you will find that – generally speaking – people’s weight increases with their height (Figure 2a). However, the relationship falls within a cloud around the trendline. Contrast this with the relationship between refractive index (°Brix) and metalworking fluid concentration ([MWF]) shown in Figure 2b. The trend lines in both graphs have the same slope, but the data point spread around the trend line is much greater for the height versus weight plot than it is for the °Brix versus [MWF] plot.
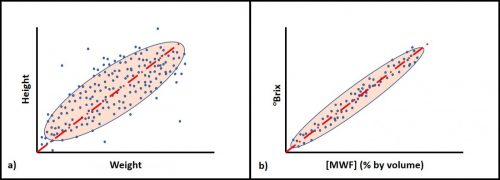
Fig 2. Correlations between pairs of parameters – a) human height versus weight (a significant, but weak correlation); b) refractive index (°Brix) versus [MWF] (significant and strong correlation).
I’ve discussed this concept in previous What’s New posts (see https://biodeterioration-control.com/microbial-damage-fuel-systems-hard-detect-part-3-testing/, https://biodeterioration-control.com/2019/07/, and https://biodeterioration-control.com/2020/03/)
The relationships among different microbiological test methods reflects the fact, that like Figure 2a, above, each method measures a different property (see https://biodeterioration-control.com/2017/07/).
Each test method tells a story
Between the dormant cell and VBNC cell factors, there are quite a few reasons that culture and non-culture testmethods can tell different stories. In some cases, culture data suggest a greater biodeterioration risk than actually exists (i.e., substantial bioburdens are not damaging the MWF). In others, culture data suggest that there is negligible biodeterioration risk but other data – such as ATP – indicate that the biodeterioration risk is great. This happens when a substantial portion of the metabolically active population is either non-culturable or clumped into masses (flocs) of cells and each such mass (100s to 1000s of cells) forms a single colony. So how do we interpret apparently conflicting data from two different methods. I’ll use culture (CFU mL-1) and cellular ATP concentration ([cATP] in pg mL-1) to illustrate the concepts.
When culture testing indicates high bioburden, but ATP data does not – if the population is dormant in the MWF but becomes metabolically active after being transferred to a growth medium, the population represents a potential risk. It is not causing damage at present, but could become metabolically active at some future point, as I will discuss below. As illustrated in Figure 3, the biodeterioration risk is moderate.
When culture testing indicates low bioburden, but ATP data indicates high bioburden – if a substantial percentage of the population is VNBC but metabolically active, it represents a current risk. Even though culture recoveries are minimal, the population is using MWF components as food and is producing acids and other metabolites that can degrade MWF performance. Per Figure 3, the biodeterioration risk is high.
It should be obvious that when both culture and ATP-bioburdens are low, the biodeterioration risk is low. Conversely, when both culture and ATP-bioburdens are high, the biodeterioration risk is high.
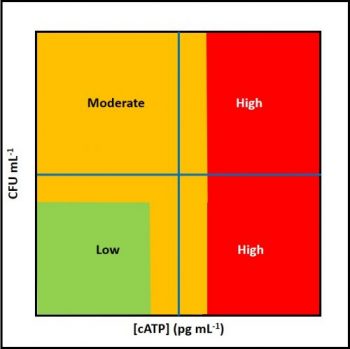
Fig 3. Biodeterioration risks based on culture and ATP-bioburden data.
Assessing microbicide performance in MWF systems
Based on the preceding background discussion, if microbicide treatments are not having the desired effect, it is important to assess whether the population in the treated MWF is dormant populations or not. because of the MWF dynamics, the available biocide concentration rapidly decreases to less than the critical (i.e., minimum effective) concentration with sufficient speed that bioburdens seem to yo-yo quickly (see the August 2018 What’s New article for an explanation of critical microbicide concentration).
For example, in a system with 10 % turnover per day, fluid loss through turnover rate will drop 2000 ppm biocide to 1,180 ppm in five-days. Add to that biological demand (microbicide consumption as it kills microbes) and chemical demand (microbicide reactions with other organic compounds in the MWF, dissolved metals, and salts, causing the microbicide molecule to either breakdown or become biologically unavailable) and it is easy to see how the concentration of biologically active microbicide can fall to below its critical concentration (1,000 ppm for triazine) within 4 to 5 days.
Dealing with rapidly restored bioburdens
Case 1 – Culturability is affected but [cATP] is not – If the population drops shortly after biocide addition, then the biocide is effective when it is present in the >critical concentration range. If you have a field test for microbicide concentration ([microbicide]), you can do a quick trial to track [cATP], CFU mL-1, and [microbicide] before treatment and at 8h to 12h intervals post-treatment. If the treatment is effective, within 24h the [cATP] should drop by ³2 orders of magnitude. Determine the [microbicide] at which [cATP] begins to climb and the number of days post-treatment it takes for that to happen.
Figure 4 illustrates Case 1. Initial treatment causes both CFU mL-1 and [cATP] to drop as expected. This indicates that the microbicide is effective at recommended end-use concentration. However, over time, both [microbicide] and CFU mL-1 show a seesaw pattern. As the [microbicide] decreases, CFU mL-1 increases. The [cATP] remains unaffected. This indicates that even at 750 mg L-1 (ppm), the microbicide is working as a biostat – keeping most of the population dormant.
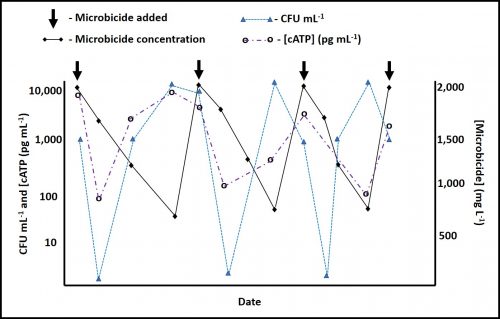
Fig 4. Microbicide effect on bioburden – Case 1.
Case 2 – [cATP] is affected but culturability is not – In this case, the CFU mL-1 is not affected by microbicide dosing. However, there is an inverse relationship between [cATP] and [microbicide]. The [cATP] initially drops in response to 2,000 mg L-1 microbicide dosing but recovers as the [microbicide] falls. Regardless of the [microbicide] the CFU mL-1 remain within the test method’s (paddles) normal variability range (±1 order of magnitude). Figure 5 illustrates Case 2.
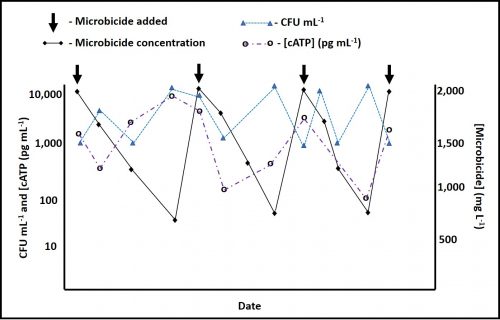
Fig 5. Microbicide effect on bioburden – Case 2.
Case 3 – [cATP] and culturability are affected – In this scenario, illustrated in Figure 6, microbicide treatment causes both parameters to fall. As the [microbicide] decreases, both culturable and ATP-bioburdens recover. Note that after a microbicide addition, the impact on CFU mL-1 is faster than the effect on [cATP]. This is because cell injuries are likely to inhibit culturability almost immediately after treatment. However, it takes longer for cells to actually die. A full effective microbicide treatment will produce data similar to that shown inf figure 6. Keep in mind that Figures 4, 5 and 6 all pertain to a high-turnover system in which dilution is the primary factor affecting the microbicide’s half-life. That said, in systems with low turnover rates (< 5 % per day), the patterns will be similar but the x-axis will stretch out.
Fig 5. Microbicide effect on bioburden – Case 3.
Sorting out the three cases
AxP testing – AxP testing uses ASTM Test Method E2694 for Measurement of Adenosine Triphosphate in Water-Miscible Metalworking Fluids to obtain extracts that include ATP, adenosine diphosphate (ADP), and adenosine monophosphate (AMP). The “x” in AxP is used to indicate that the method tests for all three molecules. Recently, Drs. Peter Küenzi, Jordan Schmidt, and I collaborated to asses the relationship between MWF additives and Adenylate Energy Charge – AEC (see https://biomedgrid.com/fulltext/volume7/adenylate-energy-charge-new-tool-for-determining.001178.php). The AxP data are used to compute AEC. Dormant or moribund populations have AEC <0.5. Healthy populations have AEC ³0.7.
Per the preceding discussion of VBNC and dormant cells, high AEC with low CFU mL-1 signals the presence of an active but non-culturable population. Conversely, high CFU mL-1 and low AEC signals that the microbes recovered by culture testing are not causing damage in the MWF. They are either dormant or dying off, but able to recover in the growth medium. I do not recommend AxP for routine testing. It is useful to make seemingly confusing or questionable data make sense.
Test for biofilm growth and biocide effect against biofilms
Commonly, we ignore biofilms (the November 2017 What’s New article discusses biofilms in fuel systems) growing on MWF system surfaces. Research has shown that both the dose needed to disinfect biofilms is typically 10x that used to kill planktonic – free-floating -cells (See December 2019’s What’s New). Additionally, the soak interval – period of contact – must be at least 24h. Biofilms periodically launch cells into the overlying fluid so that they can be transported to new surface colonization sites.
If you do not periodically eliminate biofilm populations, cells from MWF system biofilms readily reinfect the recirculating fluid as soon as the biocide concentration approaches the critical concentration. This is not an issue of dormant cells or VBNC cells. It is simply a reinfection process.
Use the DSA test method to evaluate biofilm accumulation in the system. If your DSA results are ³103 pg cm-2, you will need to do a full system clean out and recharge before you’ll be able to restore reliable bioburden control.
Summary
Although culture and ATP data generally tell the story, sometimes they do not.
If the population initially responds to microbicide treatment but recovers quickly, the two most likely causes are:
- 1. Reinoculation from biofilm communities, and
- 2. Recovery of the planktonic population when the microbicide’s half-life is shorted faster than assumed.
ATP by both ASTM Test Method E2694 & DSA testing can tell you if Cause 1 is at play. If biofilm growth is causing the data pattern you have reported, you will need to do a drain, clean, and recharge to break the cycle.
ATP, culture, & [microbicide] can tell you if cause 2 is at play. If short half-life is the issue, you’ll have to rethink your dosing plan.
AxP can tell you if there is a dormant population affecting your test results.
For more information, contact me at fredp@biodeterioration-control.com