FUEL & FUEL SYSTEM MICROBIOLOGY PART 35 – Connecting the Dots, Part 3
Refresher from Parts 1 and 2: What do Microbiology Test Results Mean?
In my January and February Fuel & Fuel System Microbiology articles, I addressed two reasons why microbiology data do not always agree with other indicators of fuel or fuel system biodeterioration. Part 33 covered dilution effects. Although direct degradation of fuels can easily be demonstrated in 1 L jars with fuel over water, when a tank has more than 1 m3 (264 gal) of fuel over traces of water, the impact that microbes have on fuel near the fuel-water interface is undetectable because the affected fuel is diluted by the unaffected fuel. I followed the dilution effect discussion with an explanation of the non-uniform distribution of microbes in fuel systems (see Part 34). Negative (i.e., below detection limit – BDL) microbial test results might indicate that there weren’t many microbes in the sample but provide no guarantee that there were no microbial contamination hot spots elsewhere in the system. In today’s post I’ll discuss differences among microbiology test methods.
Do My Microbiology Test Results Tell Me Conclusively Whether Microbes are Damaging My Fuel System?”
The answer is still: no. Most often when I detect heavy microbial contamination in fuel systems, I also see evidence of biodeterioration. However, sometimes I don’t. There are time when I recover heavy microbial loads in my sample, but I find no evidence of damage. On other occasions, all of my non-microbiology observations indicate the biodeterioration processes are damaging the fuel, the fuel system, or both, but I’m unable to detect a significant bioburden. When I run several different microbiology tests, I reduce the chances of my failing to detect microbes when they are present in the sample.
Why Don’t All Microbiology Test Methods Give the Same Results?
Different Test Methods Measure Different Properties
Consider a block of clay. Figure 1 illustrates three different measurement methods that can be used to determine how much clay there is. We can measure its length, width, and height to compute the block’s surface area. We can weigh the block to determine its mass. We can press the block into a graduated beaker to determine its volume (which – yes – was can also compute from the three linear measurements). All three approaches are valid, although each can be more appropriate than the others, depending on what you intend to do with the information. The same is true for microbiology test methods.
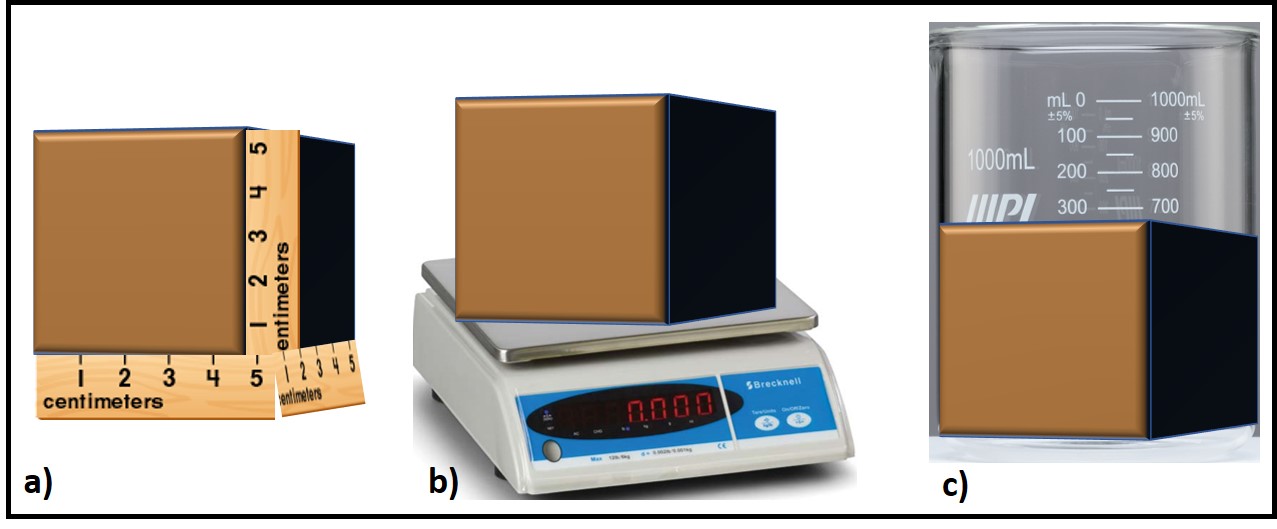
Fig 1. measuring a block of clay – a) surface area; b) mass; c) volume.
Most people responsible for fuel quality stewardship need microbiology test results that indicate whether or not corrective action is needed. The do not need a detailed description of the types of microbes present.
Microbiology Test Methods
There are three general types of microbiology test methods: direct count, culture, and chemical.
Direct Counts
Theoretically, direct count methods detect 100 % of the microbes present. However, dispersed water droplets and particulates can be incorrectly counted as microbes. Special stains can be used to determine whether the cells present are active or inactive. Organism-specific stains can also be used to determine whether microbes of concern are present. The main disadvantages for petroleum industry folks are the equipment (a good microscope), technical skill, and the amount of time (labor intensity) required to do direct counts.
Culture
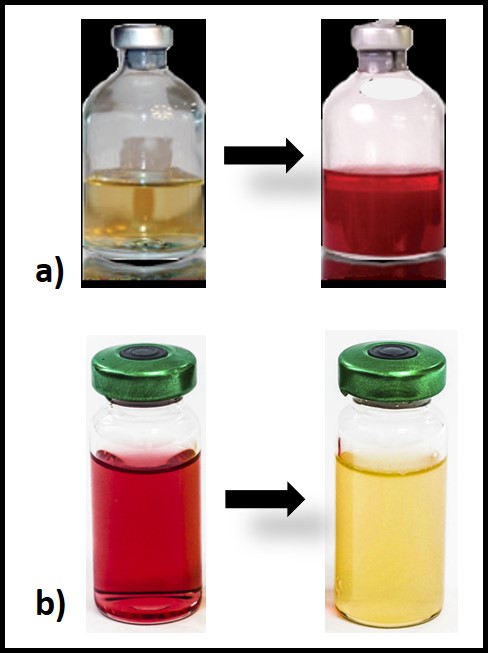
Culture tests require cells to proliferate (i.e., multiply) in a liquid (broth) or on a solid/semisolid growth medium. Proliferation in broth media is detected either by an increase in the growth medium’s turbidity or a dye’s color change. Figure 2 illustrates two types of both test kits. In figure 2a, the dye in the growth medium turns red when microbes proliferate. The number of days between inoculation and color change is used to estimate the bioburden in the original sample. Figure 2b illustrates a broth test for acid producing bacteria (APB). Typically, a series of three to five vials is inoculated – each being a 10x dilution of the one before it. If APB grow in the broth, its color will change from red to yellow. Each vial is scored positive or negative. The sample’s APB population density is computed based on the most diluted vial in which the color changed.
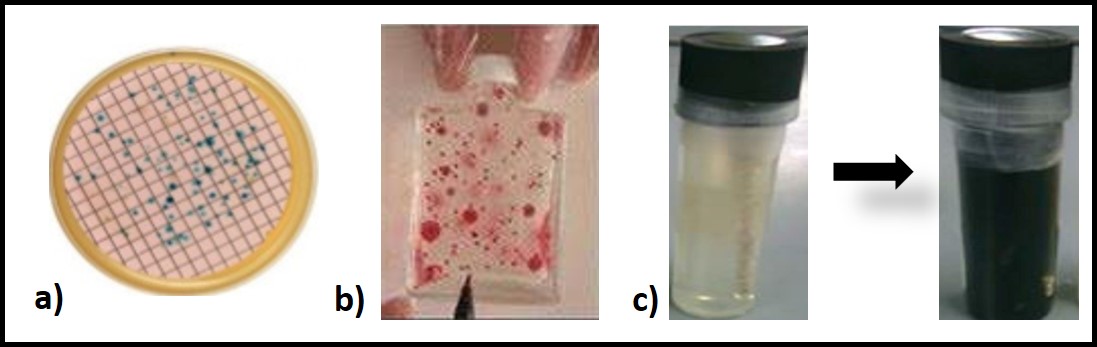
As illustrated in figures 3a and 3b, microbes form colonies when the proliferate in or on solid media. ASTM D6469 (Standard Practice for Enumeration of Viable Bacteria and Fungi in Liquid Fuels—Filtration and Culture Procedures begins with a filtration step to trap microbes onto a membrane filter. The filter is placed onto a solid, nutrient agar growth medium. Proliferating microbes from colonies on the membrane’s surface (figure 3a). For ASTM D7978 (Standard Test Method for Determination of the Viable Aerobic Microbial Content of Fuels and Associated Water Thixotropic Gel Culture Method (figure 3b) a small inoculum is added to a semi-solid growth medium. Colonies develop as red circles. A commonly used culture test for detecting sulfate reducing bacteria (SRB) uses a vial filled with a selective, semi-solid growth medium that turns black if sulfate reduction occurs – i.e., when proliferate.
Culture testing is relatively easy to perform, but detection depends on two important factors. First, only microbes able to proliferate in the nutrient medium used will be detected. Second, detection depends on a microbe’s ability to proliferate in the medium in the time frame prescribed by the test method.
Proliferation is population growth. One cell divides to become two, two to four etc. There are thousands of different growth medium recipes. Each is designated to support the proliferation of some types of microbes. General media can be used to grow diverse microbes. Selective media might support the growth of a single type of microbe. Regardless of intent, there is no single growth medium on which all microbes can grow. This challenge is made even more difficult because some microbes require oxygen while others only proliferate in oxygen-free environments. Other factors such as pH, salinity, temperature, and others determine which microbes will proliferate. Consequently, microbes that are healthy and active in the system from which they were sampled might not be able to proliferate under the test conditions used for culturing them. In the 1970s and 80s when I was able to feed microbes radiolabeled nutrients, I routinely observed high levels of metabolic activity (for example microbes using C14-glucose to produce C – carbon dioxide, the end product of mineralization) in samples from which culture data on several different types of growth media were BDL.
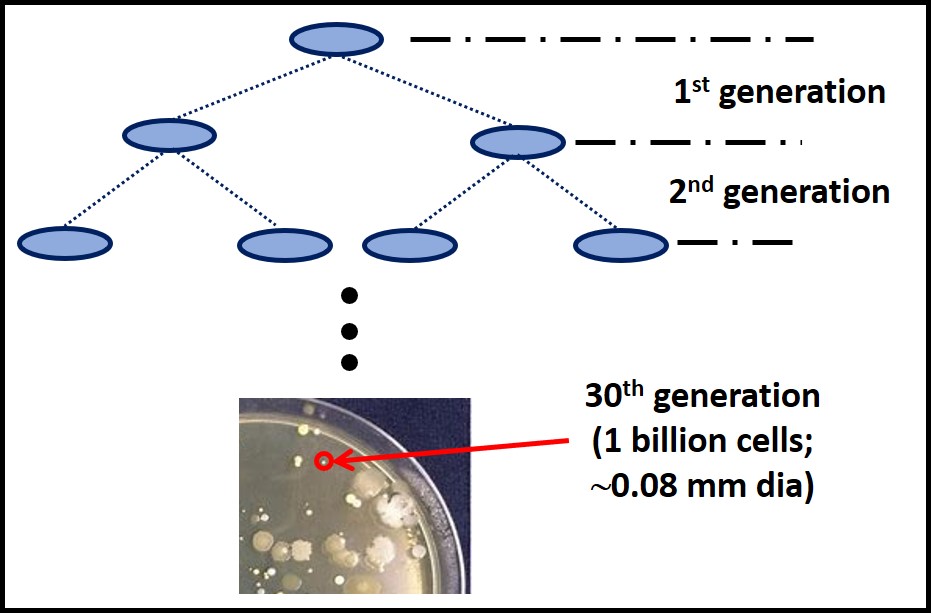
Inability to use the nutrients provided in the incubation environment is on issue. Generation time is the other. Generation time is time between cell divisions. Figure 4 illustrates this concept. During the first generation, one cell divides to produce two daughter cells. It takes 30 generations to accumulate enough cells to form a visible colony (i.e. a mass of cells with a diameter ≥0.08 mm) or 20 generations to make a broth visibly turbid. If a culture test is ended after 72h (3 days), only microbes with generation times ≤ 2.4 hours will be detected. Known microbe generation times range from 15 min to 30 days. Consequently, slower growing microbes that can proliferate in a given nutrient medium are likely to go undetected. Culture test results that might be positive after a week or two are erroneously scored as BDL.
The generation time issue illustrates what I consider to be the primary factor that makes culture testing suboptimal for condition monitoring. If data are not available for several days after testing begins – not to mention delays between sampling and testing – necessary corrective actions are delayed. This delay is unlikely to cause substantially more biodeterioration in fuel systems but it will increase the cost of predictive maintenance (PdM – see Fuel & Fuel System Microbiology Part 5).
Chemical Testing
All of the microbiology test methods fall into this broad category. I’ll discuss three categories here: adenosine triphosphate (ATP), enzyme-linked immunosorbent assay (ELISA), and genomic testing.
ATP is the primary energy molecule in all living cells. Bacterial cells contain ∼1 x 10-15 g (1 fg) of ATP per bacterial cell and ∼100 fg per fungal cell. Consequently, ATP concentration ([ATP]) is roughly proportional to the microbial population density in a sample. The original ATP test method – developed for testing water – proved to be unsuitable for brines and complex fluids such as fuels, lubricants, and oilfield produced waters. The protocol that was ultimately developed into ASTM D7687 Standard Test Method for Measurement of Cellular Adenosine Triphosphate in Fuel and Fuel-associated Water With Sample Concentration by Filtration is the only ATP test method that is not affected by these interferences (full disclosure – after 30 years of struggling to overcome the interference issue, I was involved with developing ASTM D7687). The D7687 ATP test only detects metabolically active cells. However, a variation of the basic test can be used to make dormant cells active and thereby determine whether a dormant population poses a future risk to the fuel system from which the sample was collected. Another test variation permits differentiation between bacterial and fungal contamination. The ASTM D7687 test can be completed in 5 min to 10 min and performed anywhere (I often run the test out of the back of my SUV). Because of its speed, precision, and accuracy, it is my preferred routine monitoring test method. Generally, ATP and culture test results agree. The ATP results from ∼15 % of 1,000s of samples I’ve tested indicate heavier contamination loads than those indicated by culture. Approximately 5 % of the time culture tests indicate heavier contamination. In the former case, D7687 is likely detecting microbes that would not proliferate under the culture test conditions used. In the latter case, culture testing most likely recovered microbes that were dormant in the sample but recovered once exposed to the culture medium.
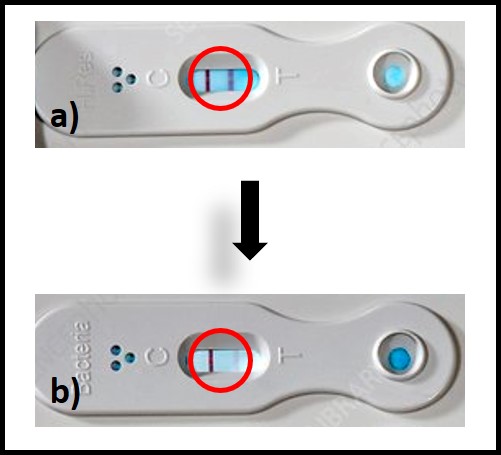
The ASTM D8070 test kit has six LDFs on a panel – two each for bacteria, total fungi, and the fungus Hormoconis resinae. One LDF of each pair detects moderate (33 μg ⁄mL to 166 μg ⁄mL) antigen concentrations and the other detects heavy (>166 μg/mL) concentrations. Like ATP testing ASTM D8070 can be completed in < 10 min. Although ASTM D8070 detects both active and dormant cells without differentiation between them, its results agree well with those obtained using ASTM D7687 ASTM D7687 s semiquantitative – given results in one of three ranges: <33 μg ⁄mL, ≥33 μg ⁄mL to 166 μg ⁄mL, and >166 μg/mL. Determining whether the test line has fully disappeared can be somewhat subjective. Decades ago, it was thought that H. resinae was the most common diesel fuel contaminating microbe. Although this has subsequently been disproven, the test kit manufacturer retains the H. resinae LFD – I suspect for sentimental reasons. D8070 is best used as a quick tool for determining if high [ATP] is due to bacterial, fungal or both types of microbes, rather than as a primary condition monitoring test.
Genomics is the branch of science focused on investigating genetic molecules – particularly deoxyribonucleic acid – DNA. In microbiology, genomic test methods use DNA extracted from a sample to determine what types of organisms are present. The key here is extraction. In order to get at their DNA, cells must first be broken open (lysed). If certain types of microbes in the samples are resistant to lysis, they won’t be detected. Consequently, the 80 % detection estimate for genomic testing assumes that in environmental samples, approximately 20 % of the cells present will not lyse. As lysing method improve, so should genomic test detecting percentages.
Currently, there are two general types of genomic tests used. Quantitative polymerase chain reaction qPCR) and next generation sequencing (NGS). Both methods use the enzyme DNA polymerase to generate millions of copies of the DNA molecules present in the original sample. qPCR methods are used to quantify specific genes, such as the dsrB gene present in all sulfate reducing bacteria. NGS looks at either 16S ribonucleic acid (RNA – bacteria), 18S RNA (fungi) or whole genome sequencing. Where qPCR can quantify the number of cells (actually copies of the target gene), NGS can provide a profile of all of the different types of microbes present. The great advantage of genomic testing is that the methods detect culturable and non-culturable microbes and identify the types of microbes present. Depending on the method used, detection can be fairly general (i.e., APB, SRB, etc.) or specific (i.e., H. resinae, Pseudomonas aeruginosa). I am currently evaluation the relationship between qPCR for total prokaryote (bacteria) and [ATP] (watch this blog for updates). Although field qPCR tests have recently become available, the level of information provided is more than that needed for routine condition monitoring. For now, genomic testing is best used as a follow-up diagnostic tool. NGS data is best used to prioritize target microbes qPCR test development.
Correlation Versus Agreement
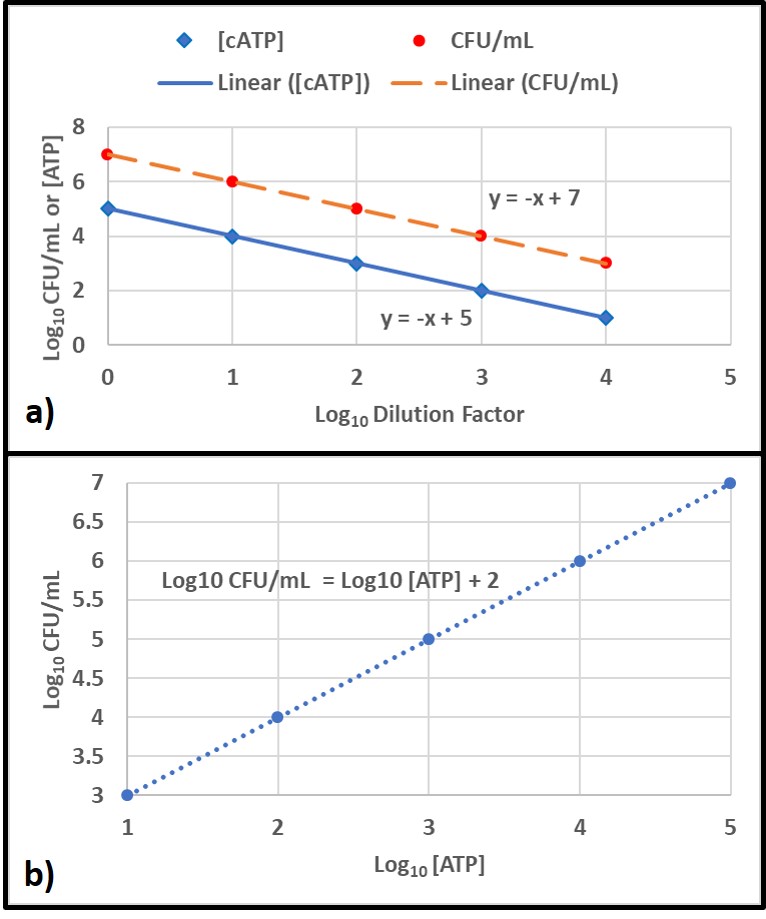
A correlation is a linear relationship between two parameters. A good example of this is the relationship between two test methods use to measure bioburdens in a series of dilutions of an original sample. In this example, the types of organisms present is constant but the number of cells/mL varies linearly with the dilution factor. Figure 6a shows how each parameter decreases with increasing dilution factor. Figure 6b shows that the correlation between the two parameters is linear across the tested range.
In contrast, agreement refers to the likelihood that two parameters will lead to the same attribute score. For example, except for genomics, all of the microbiology parameters I’ve discussed in this article have recommended attribute scores: negligible, moderate, and heavy/high. Because each parameter measures a different aspect of the bioburden, agreement is more relevant than correlation. For example, in the ATP and ELISA test comparison mentioned above, results from 128 samples were compared. For 108 of the samples, both methods yielded the same attribute scores (84 % agreement). This degree of agreement indicates that both methods are providing reliable indications of fuel bioburdens.
Bottom Line
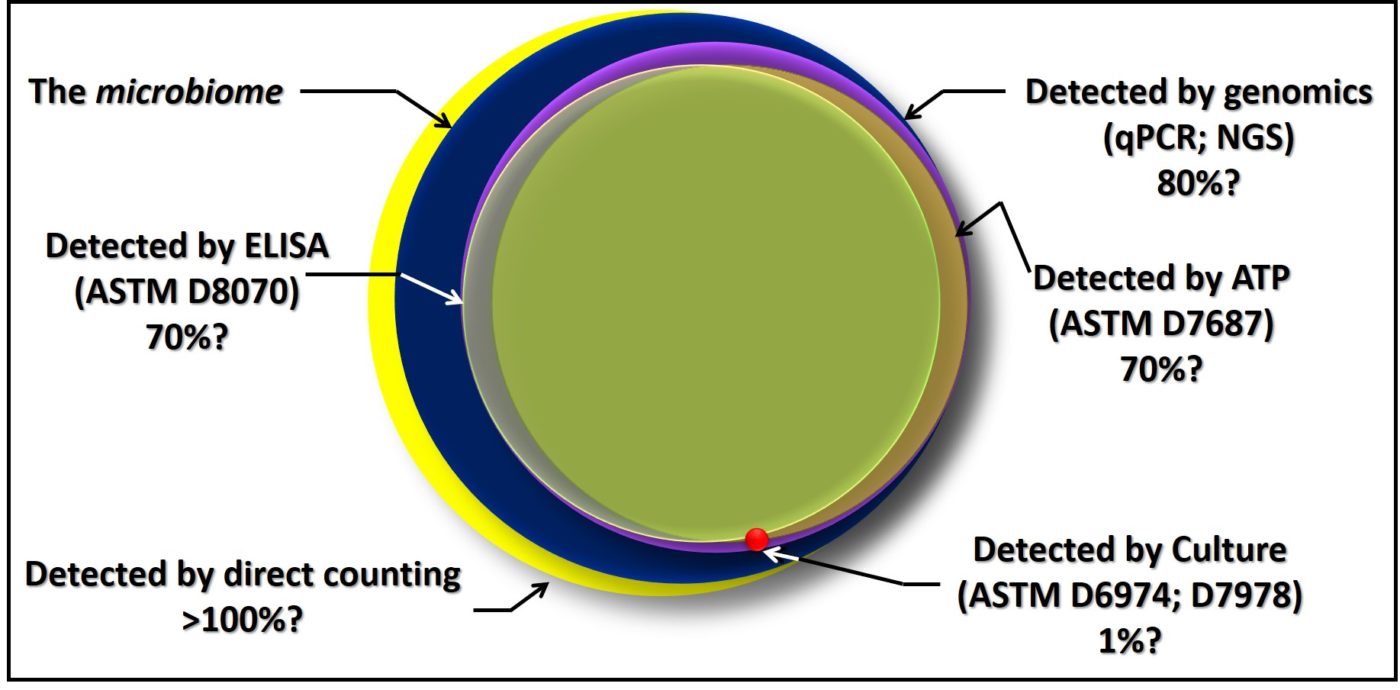
There is no best method for microbiology testing. Each serves an important purpose. Each has advantages and disadvantages relative to the others for different purposes. For example, although culture testing involves a long delay between initiating the test and having results, it is the only approach that provides isolated microbes for further study. Figure 7 is a Venn diagram illustrating the relationships among the different methods I’ve discussed in this post. Except for direct counts, which include erroneous counting of inanimate particles and water droplets, all of the methods detect some portion of the total microbiome. Note also the considerable overlap – i.e., agreement – among the methods. Still, there are regions where the circles do not overlap. It is in these regions that results from different methods are likely to not agree.
Based on my field experience, I personally prefer ASTM D7687 for routine microbial contamination, condition monitoring testing. If I am doing diagnostic work, I’ll run additional microbiology tests to supplement high [ATP] results. Historically, I’ve run differential culture tests on samples with high [ATP]. As qPCR become less expensive, I’m beginning to replace differential culture with genomic testing. As I’ve written in previous blogs, as long as consensus standard test methods are being used, the relationship between microbiological data and other fuel and fuel system test data is more important than the relationships among different microbiology test results.
In Part 4 I’ll discuss the impact of specific microbial activities on the link between bioburden and biodeterioration.
The details
For more details about understanding the relationship between microbiology test data and fuel or fuel system biodeterioration, please contact me at either fredp@biodeterioration.control.com or 01 609.306.5250.
