Author Archive


RELATIONSHIP BETWEEN TWO BIOBURDEN TESTS IN FUELS AND FUEL-ASSOCIATED WATERS


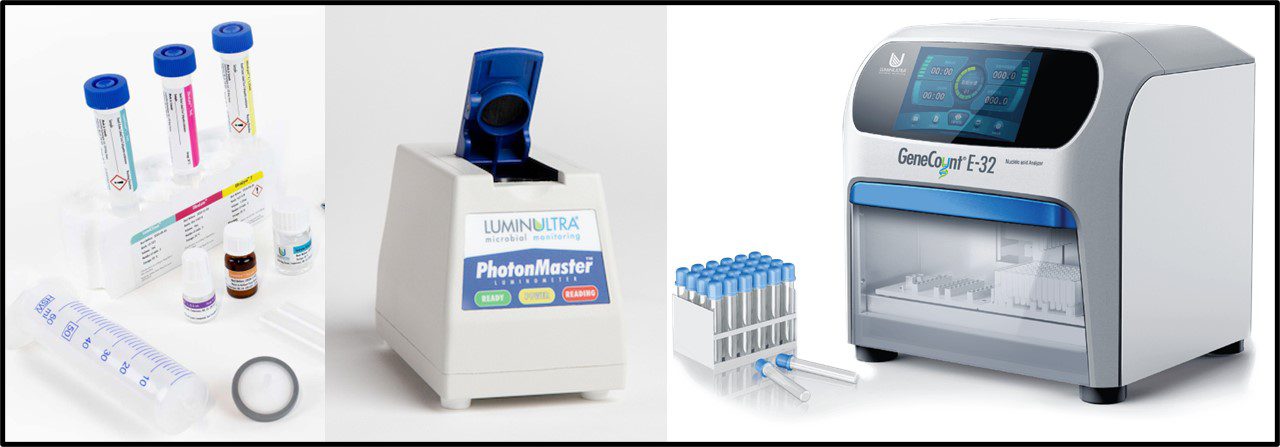
Left: ATP Test kit supplies; Center: PhotonMaster luminometer for ATP luminometry; Right: GeneCount E-32 apparatus for qPCR (Images courtesy of LuminUltra Technologies, Ltd., Fredericton, NB, Canada).

New Publication

The relationship between microbial population ATP and quantitative PCR bioburdens in diesel fuel microcosms (Access Microbiology 2024;6:000695.v4) was published last month. I’ll start this post by thanking my co-authors Dr. Jordan Schmidt and Ms. Danika Nicoletti, both of LuminUltra Technologies Ltd, Fredericton, NB, Canada) for their collaboration and the Coordinated Research Council (CRC) for funding the study from which we obtained our samples.

Measuring Bioburden

In my July 2017 post (Fuel System Microbiology Part 12 – Test Methods – Microbiological Tests), I provided an overview of the primary groups of test methods available for measuring microbiological contamination levels (bioburdens) in fuels and other industrial process fluids. I continued the overview in Fuel System Microbiology Part 13 – Test Methods – More on Microbiological Tests. In his book, “The Structure of Scientific Revolutions,” historian and science philosopher Thomas S. Kuhn (1922 to 1996) opined: “The answers you get depend on the questions you ask.” I wrote about this in my second July 2017 post. No test method is universally better than other available methods. Each approach has advantages and limitations relative to the alternative methods, depending on the information one is attempting to obtain.

For diagnostic testing, my preference is to use several different methods. Traditionally, I have used chemical microbiology methods such as catalase activity or – since 2009 – cellular adenosine triphosphate concentration ([cATP]) and various culture tests. More recently, I’ve begun to augment these tests with quantitative polymerase chain reaction (qPCR) testing. Chemical tests such as [cATP] by ASTM Test Method D7687 assess metabolically active bioburdens. Although the actual [cATP] per microorganism varies considerably due to each microbe’s genetics and physiology, hundreds of studies performed since 1954, have consistently reported that in environmental samples, [cATP] = 1 pg mL-1 ≈ 1,000 cells mL-1 (1 pg = 10-12 g). However, ATP testing only detects metabolically active microorganisms. Moreover, it does not identify the types of microorganisms present in the sample. Traditionally, culture testing (for example ASTM Practice D6974 and Test Method D7978) provided the only means of identifying the types of microbes present. Microbes that reproduced in or on nutrient media could be isolated and tested further for taxonomic identification. Moreover, microbes that were dormant in environmental samples, could recover and form colonies on nutrient media. This latter capability could be viewed as an advantage for detecting inactive microorganisms that could potentially cause problems if they became metabolically active. It could also be viewed as a disadvantage because dormant microbes that generated positive culture test results might not actually be causing problems. The risk was time and expense responding to non-existent problems.

Culture testing remains the only practical tool for obtaining pure cultures on which to perform certain types of studies. However, genomic testing has become an increasingly valuable tool for quantifying specific types of microbe present in samples. ASTM Guide D8412 provides an overview of qPCR testing. I’ll provide more details below. Here, I’ll simply indicate that qPCR can be used to assess broad groups of microbes (e.g., total prokaryotes – bacteria and archaea, or total eukaryotes – fungi, protozoa, etc.) or individual taxa (I suspect that few readers have not been tested for the SARS-CoV-2 virus – COVID – by qPCR). As with all genomic tests, qPCR depends on quantitative extraction of deoxyribonucleic acid (DNA) from all of the microorganisms in the specimen. Additionally, qPCR does not distinguish between dormant and metabolically active microorganisms. However, qPCR – now available as a field test – can provide quantitative data within a few hours. Depending on the type of microbe to be detected, culture testing can require two to 30-days or longer before final results are available.

ATP and qPCR Common Steps

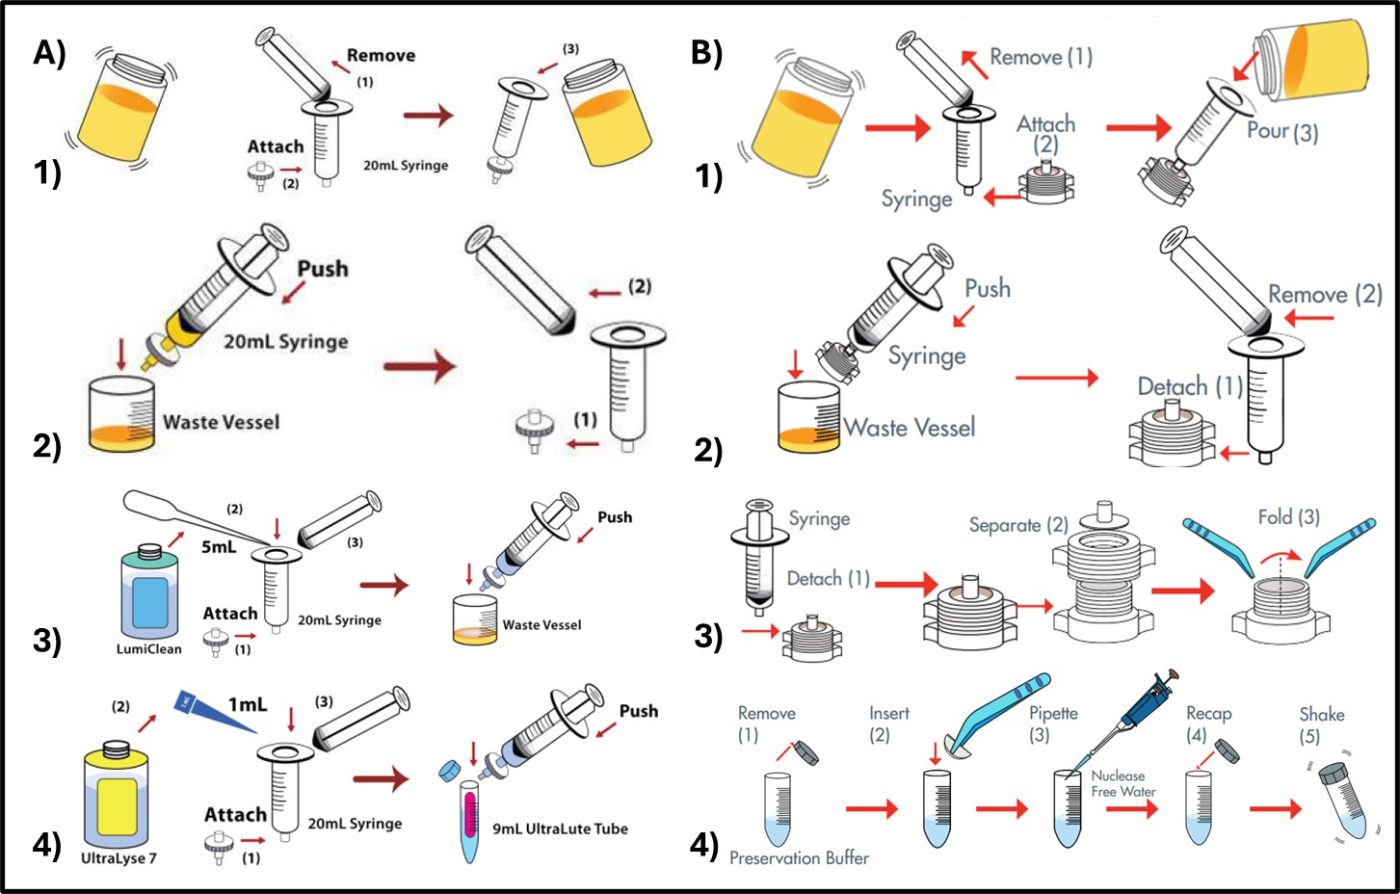
Both test methods start off with similar steps. As Illustrated in Figure 1,

  • Microbes are concentrated and separated from the sample (i.e., fuel, fuel-associated water, etc.) by filtration.
  • For ATP testing, potentially interfering chemicals are washed away. This step is not needed for qPCR.
  • For ATP testing, microbial cells are lysed (broken open) to release their contents. For qPCR cells at not lysed until after they have been resuspended from filter.
  • Retain stable extract in appropriate buffer.

The resulting extract includes all of the biomolecules that were originally present inside the intact microorganisms.


Fig 1. Initial steps for biomolecule testing – A) ATP testing – 1) microorganisms are separated from sample and concentrated by filtering through a glass fiber filter; 2) chemicals that can interfere with assay are washed away; 3) cleaned cells are lysed and their contents are captured in a test tube; 4) extract is preserved in dilution buffer. B) qPCR – 1) and 2) microorganisms are separated from sample and concentrated by filtering through an in-line filter; 3) filter is removed from housing and folded; 4) filter is suspended in preservation buffer.

ATP Test

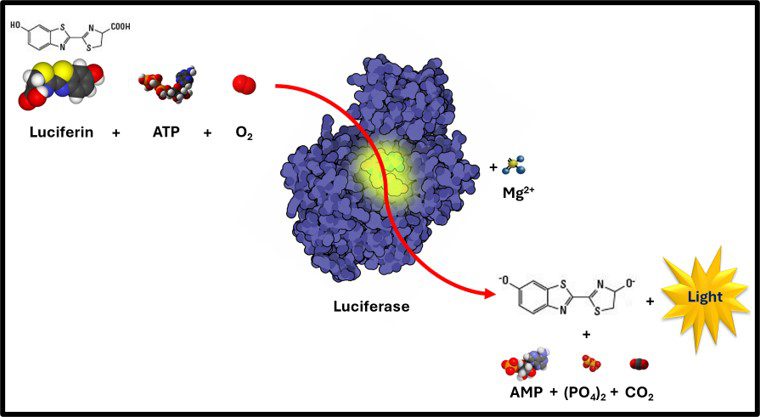
For ATP testing by ASTM Test Method D7687, the extract is diluted into a reagent that neutralizes any residual wash or extraction reagent that could interfere with the assay. A 100 μL specimen of diluted extract is reacted with 100 μL of Luciferin-Luciferase reagent in a cuvette. The cuvette in placed into a luminometer (device designed to detect the photons of light generated when a molecule of ATP reacts with Luciferin enzyme and Luciferase substrate as summarize in Figure 2). Because every luminometer is unique, the raw results are in relative light units (RLU). The RLU from test specimens are compared against those from a 1 ng mL-1 ATP reference standard to convert RLU to cellular ATP concentration ([cATP]) in pg mL-1.


Fig 2. ATP-mediated Luciferin Luciferase reaction- a) Luciferian + ATP + O2 react enzymatically with; b) Luciferase Enzyme and Mg2+ co-factor to produce; c) Oxyluciferin + AMP + (PO4)2 (pyrophosphate) + CO2 + a photon of light.

qPCR Test

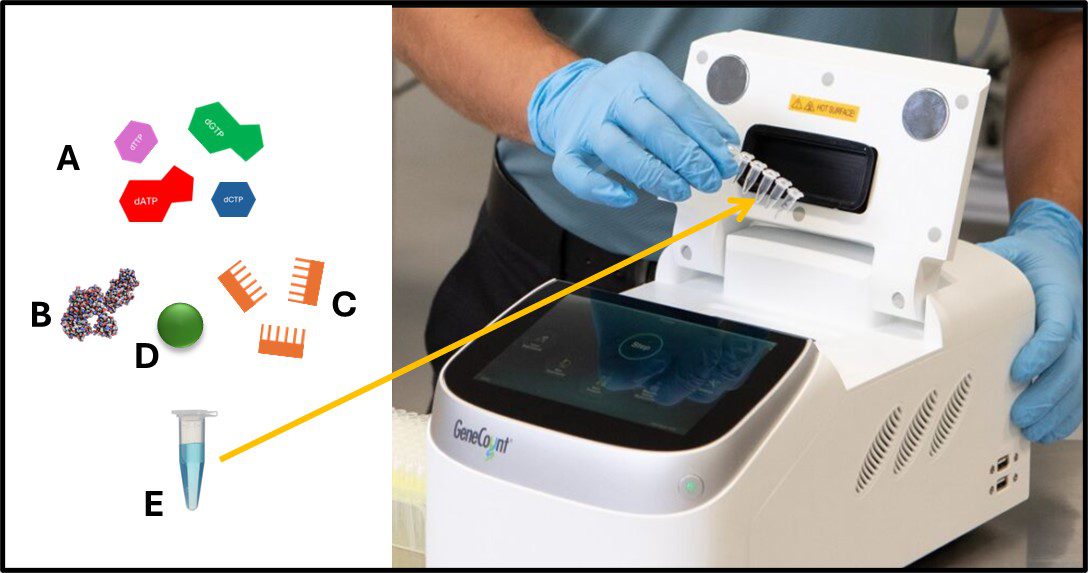
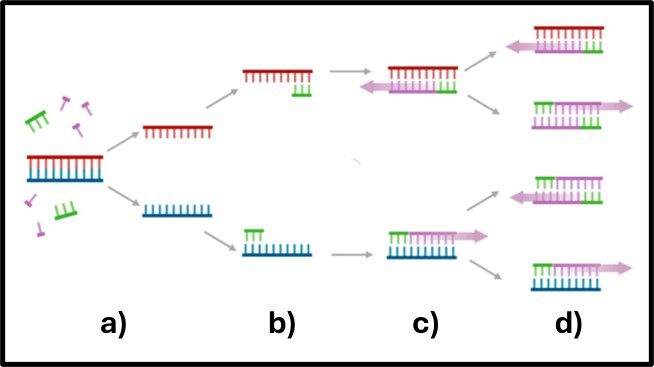
For qPCR testing, DNA is extracted from the filter through a sequence of steps that includes cell lysis, and DNA purification. The specimen DNA is resuspended in a buffer (Figure 3) and reagents that include deoxynucleotides (deoxyadenosine triphosphate – dATP, deoxycytidine triphosphate – dCTP, deoxyguanosine triphosphate – dGTP, and deoxythymidine – dTTP), DNA-polymerase, oligonucleotide primers, and a fluorescent dye (Figure3, A, B, C, and D, respectively) are added to a microcentrifuge tube (Figure 3 E) containing the specimen DNA. As shown in the Figure 3 photograph, the cuvette is then placed into an apparatus that runs a series of heating and cooling cycles to alternately denature the specimen DNA (Figure 4a), allow the primers to attached to any matching nucleotide sequences (i.e., genes) on each of the DNA single strands created by the denaturation step (Figure 4b), and allow new double stranded DNA to form (Figure 4c). The amount of DNA that contains the target gene(s) doubles with each thermal cycle (Figure 4d).


Fig 3. qPCR sample handling – A) deoxynucleotides (dATP, dCTP, dGTP, and dTTP); B) Taq-polymerase; C) 16s RNA primers; D) SYBR Green fluorescent dye; E) DNA specimen in buffer. Photo: Six microcentrifuge tubes being placed into qPCR apparatus.


Fig 4. qPCR gene amplification – a) DNA denatured at ~95 °C; b) primers attached to matching genes and DNA anneals at ~68 °C; c) DNA elongates to form new double-stranded DNA; d) after next heating and annealing cycle the number of DNA copies doubles.

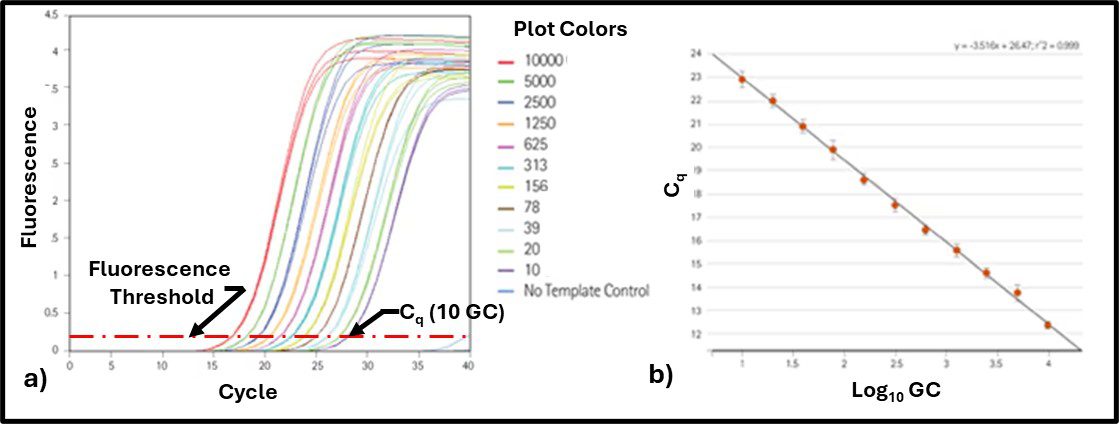
The number of thermal cycles needed before the number of gene copies (GC) exceeds a critical threshold (Cq – quantification cycle – the fluorescence at which the signal from the dye linked to DNA is significantly greater than the background fluorescence). Figure 5a illustrates fluorescence curves for known concentrations of a target gene’s DNA. A correlation curve can then be generated by plotting Cq as a function of DNA concentration (GC mL-1) as shown in Figure 5b.


Fig 5. qPCR standard curve – a) fluorescence as function of amplification cycles; b) Cq and a function of the number of gene copies mL-1 (Log10 GC mL-1).

The regression equation for the Figure 5b plot is then used to compute target gene Log10 CG mL-1 in test specimens. For the study reported in our recently published paper the primers were designed to detect either total prokaryotes (TP) or total fungi (TF). Results are reported as gene copies (or amplicon units – AU) rather than as cells because the number of copies each microorganism has of each gene varies among organisms and genes. Thus, for a particular gene, one type of microbe can have more GC than another. Similarly, a given microbe can have more copies of some genes than others. That said, as our investigation demonstrated, there is excellent agreement between ATP and qPCR bioburdens.

Results Comparison

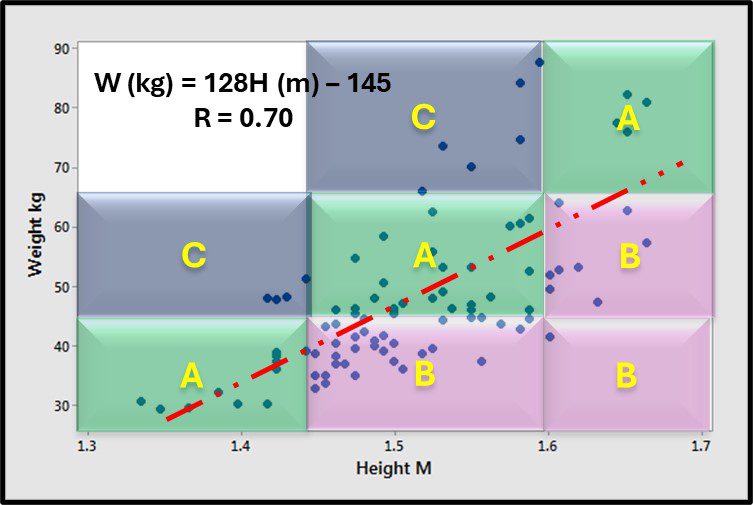
As I discussed above, each microbiology property is affected by different factors. Most commonly, genetics and physiology affect concentrations of biomolecules in microorganisms. Rather than focus on linear correlation, it is more useful to compare attribute score agreement among parameters. For example, consider the relationship between height and weight (Figure 6). Although there is a good, positive correlation between the two parameters, there is substantial spread around the trend line. If one creates height and weight categories (short, medium, and tall; light, medium, and heavy) and compares the respective categorical scores, the height and weight scores agree for 44 % of the 88 individuals tested (Figure 6, green shaded regions; data points close to the trend line). For another 44 %, heights are greater than one would predict from subjects’ weights (Figure 6, purple zones; data points are well below the trend line). Only 12 % of the subjects were heavier than expected based on their height (Figure 6, blue-grey zones).


Fig 6. Scatter plot – relationship between height and weight – A) categorical scores for height and weight agree; B) categorical scores for height are greater than those for weight; C) categorical scores for height are less than those for weight.
Similarly, the plots for [cATP] (pg mL-1) versus qPCR (GC mL-1) had considerable scatter but, as shown in Figure 7, their respective categorical scores agreed for 60 % of the samples tested. The ATP-bioburden categorical scores were greater than the qPCR scores for 28 % of the samples and less than the qPCR scores for 12 %. In previous studies, agreement between ATP scores and those obtained by either culture testing or immunoassays were approximately 80 %. This probably reflects the greater variability of GC cell-1 and its impact on qPCR bioburden data.

This study used qPCR primers designed to detect all prokaryotes and all fungi, respectively. However, the growing library of primers now makes it possible to detect microbes with genes directly associated with specific types of biodeterioration (for example, microbiologically influenced corrosion). The test equipment and reagents make it possible to run qPCR in the field, on samples with [cATP] greater than a predetermined upper control limit. Additionally, DNA extracted for qPCR testing can also be used to obtain complete genetic profiles of contaminant populations.


Fig 7. ATP and qPCR categorical score (CS) agreement among 88 samples – A)CSATP = CSqPCR; B) CSATP > CSqPCR; C) CSATP < CSqPCR.

Next Steps

The study reported in June’s Access Microbiology paper was just a beginning. The testing was performed on samples available from a microcosm study. The timing was serendipitous. The good agreement between ATP and qPCR biomass determinations validated the qPCR test method. The next step will be to build a large database of fuel and fuel-associated water test results that include ATP, qPCR, and metagenomic profiles. ATP will provide total metabolically bioburden information. The qPCR data will provide quantitative measurements of various microorganisms of interest. The “of interest” list is likely to change as we get a better understanding of the types of microorganisms present and the relationship between those microbes and biodeterioration.

Summary

I am a proponent of tiered testing. Tier 1 tests are easy to perform while on-site near the point where I collect my samples. They provide reliable data within a few minutes. My primary, Tier 1 microbiology test is ATP (ASTM D4012 for interference-free, water samples, D7687 for fuel and fuel-associated water samples, and E2694 for metalworking fluid and lubricant samples). Although a differential test is available for distinguishing between bacterial and fungal contamination it does not provide gene-targeted test results the way qPCR does. Increasingly, qPCR is my go to Tier 2 test. When the [cATP] is greater than the upper control limit, I have a qualified lab run one or more qPCR tests. I am aware of several oilfield service companies whose field technicians run qPCR tests from the back of their cars. I am also using full genomic profiling to better understand whether specific types of microbes are always present when biodeterioration is occurring. By combining microbiological data with engineering, physical, and chemical data, I hope to be able to recommend more cost effective microbiological contamination control strategies.

I look forward to your thoughts and questions about how industry stakeholders can reverse this shrinking availability of biocidal products. Contact me at fredp@biodeterioration-control.com.

THE CONTINUED IMPORTANCE OF MICROBICIDES IN INDUSTRIAL APPLICATIONS


The Challenge

At this year’s STLE Annual Meeting I presented a paper titled: “The continued importance of antimicrobial pesticides for controlling microbial contamination in industrial process fluids and systems.” Subsequently, the editors of Lube Magazine (https://www.lube-media.com/) invited me to write an article on the topic. That article – available from the Lube Media website only to Lube Magazine subscribers – was published in Lube Magazine, Issue 181, June 2024. I’ve also archived the article here on BCA’s website.

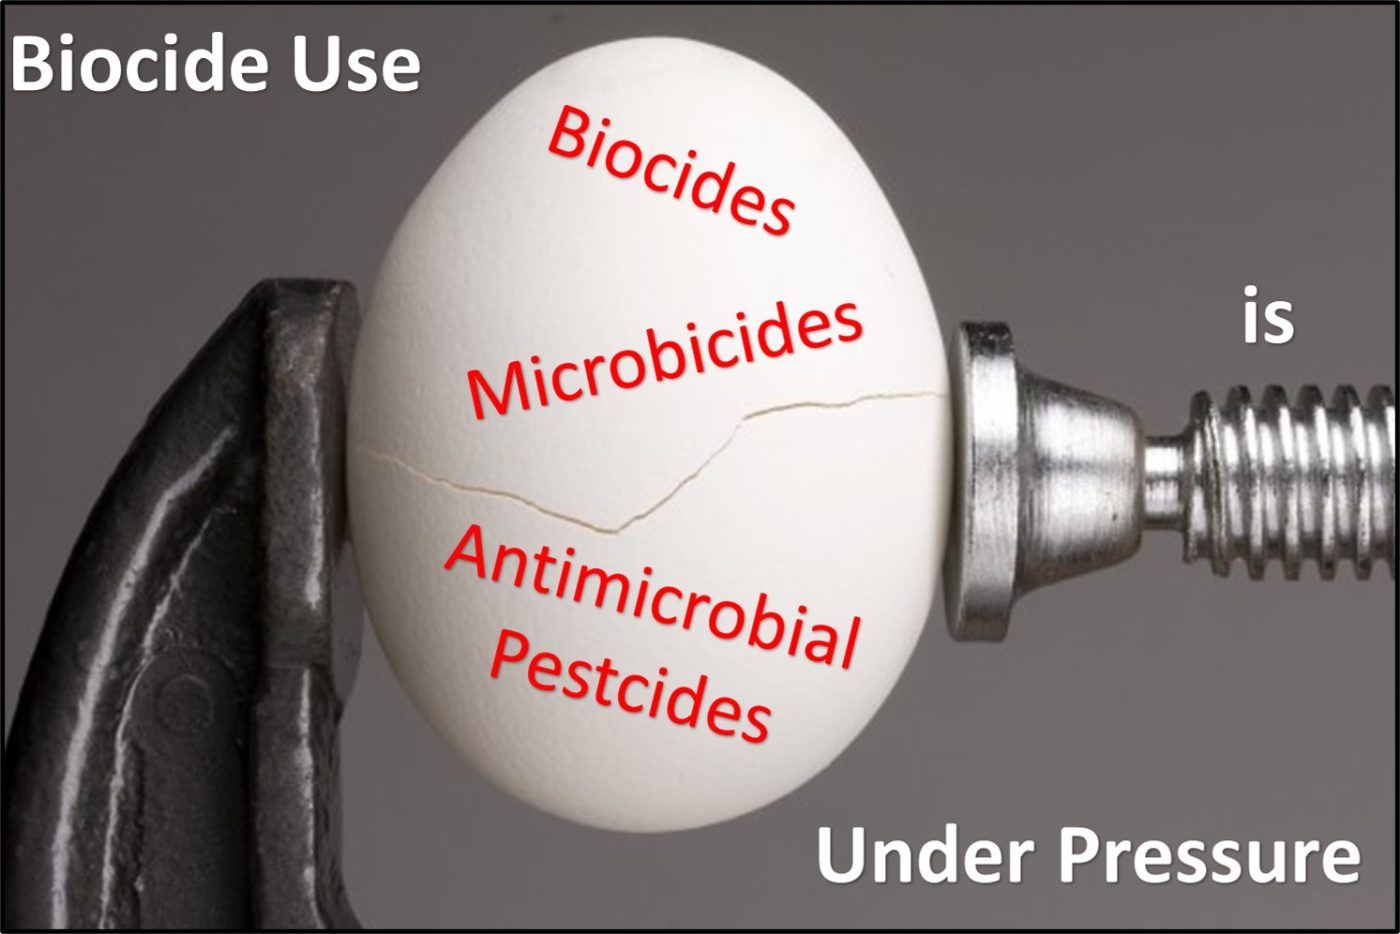
The crux of the issue is that for the past several decades, regulatory agencies have been increasingly myopic regarding the assessment of risks associated of biocidal products. The net effect has been a shrinking number of microbicidal active substances approved for use in Canada, Europe, the U.S., and other countries where microbicide use is regulated. The number of toxicological and environmental tests required to support new-product and registration renewal applications continues to grow as do end-use restrictions. For example, in 2000, the average cost for toxicological testing in support of industrial microbicide applications was less than $200,000 U.S. As of 2022, that average cost was between $1 million and $2 million U.S. The total global market for microbicides used in metalworking fluids (MWF) is estimated at $300 million U.S. Consequently, the potential return on investment no longer justifies the development of new active substances for controlling microbial contamination in MWF. Even the initial investment in toxicity testing to support product registrations is insufficient. All registered biocidal products are reviewed periodically for reregistration eligibility. In their 27 June 2008 Reregistration Eligibility Document (RED) for Hexahydro-1,3,5tris(2hydroxyethyl)-s-triazine (triazine), the U.S. EPA limited the maximum end-use dosage to 500 ppm – a dosage that’s less than the minimum concentration needed for triazine to work effectively. U.S. EPA’s OPP cited their concerns over formaldehyde exposure risk and their (incorrect) understanding of a 2023 paper.

Regulatory Agencies and Regulations

Table 1 lists selected regulatory agencies responsible for pesticide use oversight in the EU and specific countries, and the regulations under which the different agencies function. Within the EU, biocidal products approved by ECHAs Biocidal Products Committee (BPC) must also be approved the cognizant agencies of each country in which the products are sold. As for all products regulated under REACH, biocidal products are assessed based on their hazard (toxicological properties) rather than the risks associated with their use. Putatively, in the U.S., the U.S. EPA’s Office of Pesticide Programs (OPP) focuses on risk (the likelihood that users will suffer injuries). However, recent RED’s illustrate how OPP administrators tend to allow their understanding of hazard to trump the risk assessment (more on this below).

Table 1. National and Regional Agencies and Regulations Administering Microbicide Use.

Country/Region
Regulation
Agency
CanadaPest Control Products Act (PCPA)Pest Management Regulatory Agency (PMRA)
E.U.Biocidal Products Regulation (BPR)Biocidal Products Committee (BPC)
IndiaGuidelines for the Registration of Biocide and Biocide ProductsCentral Insecticide Board and Registration Committee (CIB&RC)
JapanChemical Substances Control Law (CSCL)Ministry of Economy, Trade, and Industry (METI)
People’s Republic of ChinaNew Pesticide Management RegulationInstitute for the Control of Agrochemicals, Ministry of Agriculture (ICAMA)
U.S.Federal Insecticide, Rodenticide, and Fungicide ActU.S. Environmental Protection Agency, Office of Pesticides Programs (U.S. EPA, OPP)

Note: a) This list illustrates the fact that globally there are numerous agencies responsible for regulating biocide use. It is not meant to be exhaustive.

The list of animal and ecotoxicological tests required varies by agency. In the U.S. an initial, relatively short list of toxicological tests are required in support of a pesticide application. The OPP representative reviewing the application can request additional tests. It is common for applicants to spend years incrementally supplying OPP with additional test results. Rather than either rejecting an application or providing the applicant with a compete list of additional tests that must be performed, OPP application reviewers tend to request additional tests, one at a time. For one product of which I am aware, the application for OPP approval for a product to be used in MWF has been going on for more than 15 years. In other instances, microbicide manufacturers had opted to withdraw heir products from the market rather than spend $ millions on additional toxicity, environmental fate and persistence, or both types of tests required in support of REDs. As a result, the number of microbicides available for use in MWF in the U.S. is <30 % of the number that were available in 1995. Similarly, in the EU, only 27 active substances are currently approved for use in MWF. That list was >200 in 1995.

Factors Driving Increased Regulatory Pressure

Hazard and risk conceptual conflation

You have no doubt seen variations of the meme in which a character is so focused on a relatively minor hazard that they are oblivious to a major one (Figure 1). A person backs away from a mouse and over a cliff, person is so focused on a bear cub that they remain unaware of the mama bear that’s about to attack – the examples go on. The issue is the same for the human tendency to conflate hazards with risks.


Fig 1. From the frying pan into the fire – person climbing the fence to escape the growling (petite) dog will undoubtedly not like the crocodiles waiting for him once he climbs over.

As I noted above, risk (R) is the likelihood (probability) that harm will occur. It is a function of hazard (H) and exposure (E), where hazard is the severity of harm likely to occur when the agent is contact, and exposure the degree of contact:

R = H x E      (1)

For chemical substances, hazard is assessed based on the doses at which different types of toxicological damage occur. Dosage for direct contact or ingestion is reported in mg of test substance per kg of test organism body weight (mg kg-1). For inhalation studies, it is reported as mg L-1 in the air the test organisms breath. Most commonly, the hazard measured is death, and the end point is the test substance concentration that kills half of the exposed population (lethal dose 50 – LD50 or lethal concentration – LC50). The acute tests that are required universally include:

  • Oral toxicity
  • Eye irritation
  • Dermal toxicity
  • Skin irritation
  • Inhalation toxicity
  • Skin sensitization

Other endpoints include tissue damage, impact on the test organisms’ metabolism, and other pathological symptoms. Acute toxicity tests measure the effect of a single exposure. Sub-chronic toxicity tests measure the effect of repeated exposures during a one-month test period. Chronic toxicity tests evaluate the test substance’s impact during the life of the test organism.

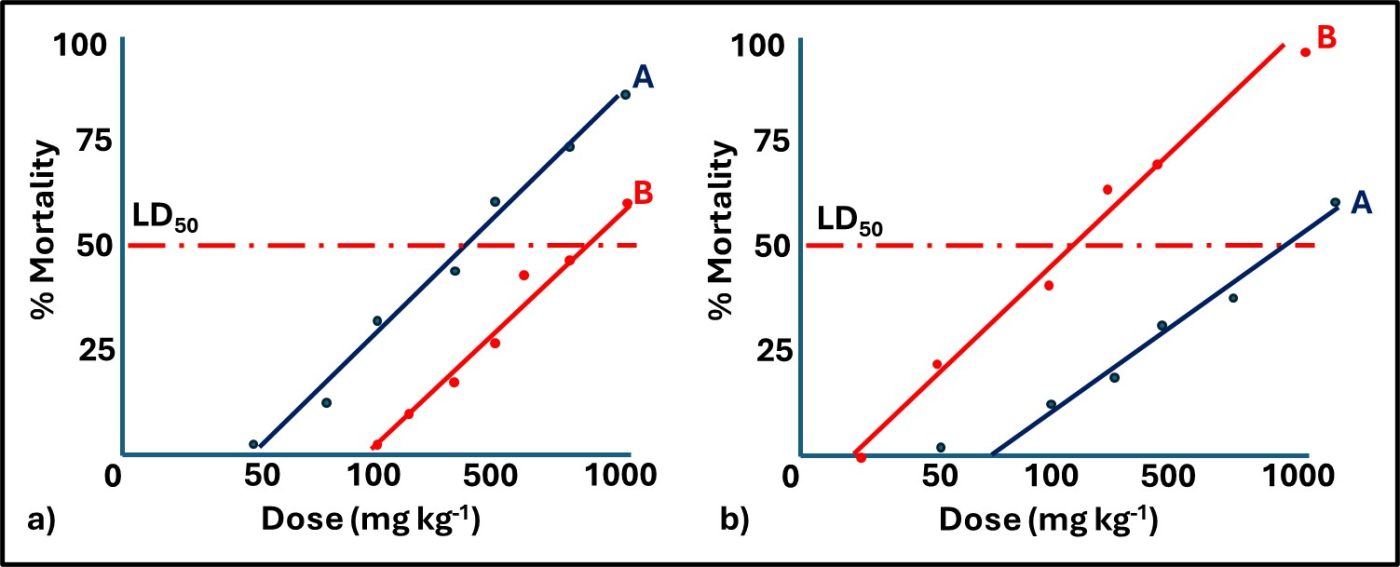
A chemical substance’s toxicity depends on its route of exposure. Figure 2a compares the acute oral toxicities of two chemicals I’ve designated as A and B. Figure 2b compares the acute dermal toxicities for the same two chemicals. Note that for oral toxicity, chemical A is more toxic than chemical B, but that for inhalation toxicity, B is more toxic than A. For chemical A, the oral LD50 = 200 mg kg-1 and the dermal LD50 is 1,000 mg L-1. Conversely, chemical B’s is more toxic through dermal contact than it is via the oral route.


Fig 2. Acute toxicity dose response curves – a) oral toxicity: substance A’s and B’s LD50 = 200 mg kg-1 and 750 mg kg-1, respectively; b) dermal toxicity: substance A’s and B’s LC50 = 1000 mg kg-1 and 100 mg kg-1, respectively.

In Figures 1a and 1b, none of the trend lines intersect with the Dose axis at 0 mg kg-1 or 0 mg L-1. The doses at which the trend lines intersect the Dose axis is called the no observable effect level (NOEL). Biological modeling plots toxicity test results to show the NOEL. Linear modelling forces the trend line through the origin (i.e., 0 % mortality at 0 mg kg-1 test substance concentration). If the four trendlines in Figure 1 were adjusted to go through the origin both test substances would appear to be more toxic than they actually are. The U.S. EPA uses the linear model to assess test substance toxicity. In other words, they tend to overestimate the hazard.

The second factor affecting risk is exposure. Exposure is a function of a substance’s concentration and the period of exposure. Being struck by a moving car is a hazard. The risk of being struck depends on the number of cars passing the exposed individual per unit of time (e.g., minute). In terms of cars passing per minute, in Figure 3 the couple walking on a country lane are exposed to a fraction of the cars to which the crowd walking on the freeway are. In industrial settings, without appropriate industrial hygiene controls in place (personal protective equipment, ventilation, etc.) workers handling concentrated chemicals potentially experience greater exposure than do workers exposed to diluted chemicals. However, when the workplace complies with hazardous material handling regulations, worker exposure is minimized.


Fig 3. Exposure – the couple on the left, walking on a country lane, are exposed to far fewer cars than are the people walking into a traffic-dense highway.

According to the Governors Highway Safety Association (GHSA), there were 7,485 pedestrians killed by moving vehicles in 2021. I’ll leave it for my readers to speculate how that statistic compares with the total number of industrial workers who have been killed by microbicide exposure in the past 100 years. When injuries have occurred, the cause has invariably failure to follow manufacturer’s handling instructions. The number of injuries associated with accidental exposure to non-biocidal chemicals is much greater than the number related to biocide exposure.

Narrow risk focus

Microbicides serve an important function. They are designed to control microbial contamination – they kill microorganisms. Globally, damage caused by microorganisms is estimated to cost hundreds of $ billions annually. These costs include spoilage (food, process fluids, specialty chemicals, paints and coatings, personal care products and countless other biodegradable materials), structural damage (primarily microbiologically influenced corrosion and biofouling), and health effects (allergies, toxemias, and infectious diseases). Microbicides play an essential role in reducing the health risks and other costs associated with microorganisms. However, regulatory agencies rarely consider the risks associated with not controlling microbiological contamination.

The formaldehyde issue

Currently, the U.S. EPA has targeted all formaldehyde-condensate microbicides for elimination. Their logic is:

Argument 1: Formaldehyde is a carcinogen.

Argument 2: Formaldehyde-condensate microbicides are manufactured by reacting formaldehyde with one or more other chemicals.

Argument 3: The mode of action of most formaldehyde-condensate microbicides is to release formaldehyde so that it can react with microorganisms’ structural and enzyme proteins.

Argument 4: If formaldehyde is released when formaldehyde-condensate microbicides kill microorganisms, it must also be released when those microbicides are diluted into treated fluids (e.g., metalworking fluids, paints, personal care products, etc.).

Therefore, people using formaldehyde-condensate microbicides are exposed to formaldehyde.

Unfortunately, this logic is flawed. The facts do not support argument 4. Modern analytical chemistry testing on fluids treated with formaldehyde-condensate microbicides have demonstrated that if any free-formaldehyde is present, it is at concentrations below detection levels (i.e., <1 μg kg-1 – ppb). Moreover, studies to test for formaldehyde in the air above formaldehyde-condensate microbicide treated and untreated metalworking fluids have determined that statistically there is no difference.

There’s a second flaw in the logic. The EPA recognizes that living beings produce formaldehyde. Except for the studies showing that formaldehyde concentrations in the air above untreated metalworking fluids were in the same range as above treated fluids, no research has reported the impact of uncontrolled microbial contamination on formaldehyde. Studies have also demonstrated that only formaldehyde-condensate microbicides denature endotoxins produced by Gram-negative bacteria that commonly grow in metalworking fluids. These last two considerations suggest that if formaldehyde-condensate microbicides can no longer be used in metalworking fluids, worker health risks due to endotoxin and other biological components (bioaerosols) would be greater than it is at present. It would be like rolling the microbial contamination control clock back to the 1960s when operators never had microbiological problems. Back then they only had odor problems.

In 1996, Lubrication Engineering published my paper: “Formaldehyde Risk in Perspective: A Toxicological Comparison of Twelve Biocides.” In that paper, I compared toxicity date for formaldehyde and a dozen MWF microbicides. The list included formaldehyde-condensates and nominally formaldehyde-free microbicides. In most test categories, the microbicidal products were less toxic than formaldehyde. None were either mutagenic or carcinogenic. Toxicity was not related to the presence of formaldehyde as a reactive intermediate.

The U.S. EPA has not been deterred by these facts. It is likely that formaldehyde-condensates will no longer be approved for use in MWF or other industrial applications.

Hysteria versus science

Equation 1 illustrated the relationship between hazard, risk, and exposure. It does not include the term that often overwhelms scientific assessment. That term is outrage. Outrage is the reaction individuals have to what they perceive to be unacceptable risk. This acceptability assessment is purely subjective. Risks that some people find totally acceptable, others find intolerable. Intolerance leads to outrage. Despite the well documented risks linked to smoking, the population of smokers consider the risk to be acceptable. Some non-smokers respond to secondary smoke exposure with outrage. Similarly, despite the nuclear power industry’s remarkable safety record, opponents of nuclear energy commonly react to proposed nuclear power generation facility construction proposals with outrage. Invariably, hard data are discarded when outrage appears. For biocides, it is the word itself rather than biocidal product toxicity that triggers outrage.

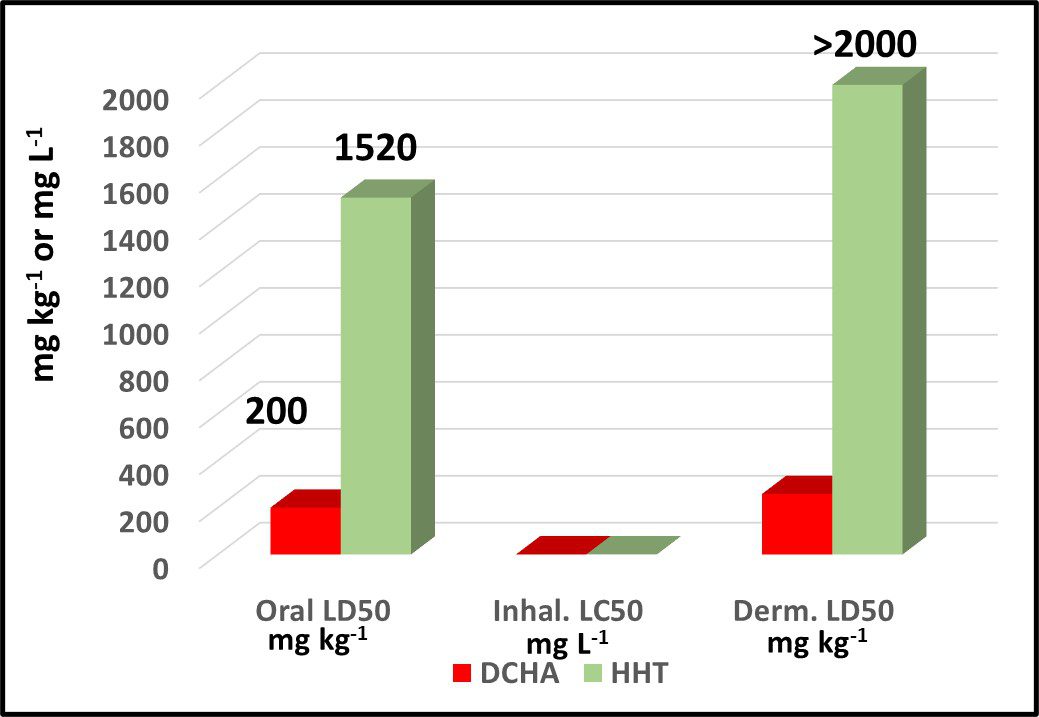
The words “biocide” or “microbicide” stimulate fear and anxiety even when the product’s toxicological data are more benign than those of other industrial chemicals. For example, in recent years a growing number of MWF compounders have been promoting biocide-free products. Some have been replacing traditional microbicides with an amine – dicyclohexylamine (DCHA). To date, the only published DCHA performance data demonstrate that it prevents uncontrolled microbial contamination from developing in MWF. Nothing has been reported about DCHA’s performance as a corrosion inhibitor, pH buffer, or other non-biocidal, functional additive. Figure 4 compares the acute oral, dermal, and inhalation toxicities of DCHA and hexahydro-1,3,5-tris(2-hydroxyethyl)-s-triazine (triazine – HHT). DCHA’s acute oral toxicity is 7x greater than HHT’s and its dermal toxicity is >10x that of HHT. Although HHT has a record of >70 years of safe, effective use, it is being replaced by a more toxic product that does not have a pesticide registration.


Fig 4. Toxicity comparison – dicyclohexylamine (DCHA) and hexahydro-1,3,5-tris(2-hydroxyethyl)-s-triazine (HHT).

A Rational Path Ahead

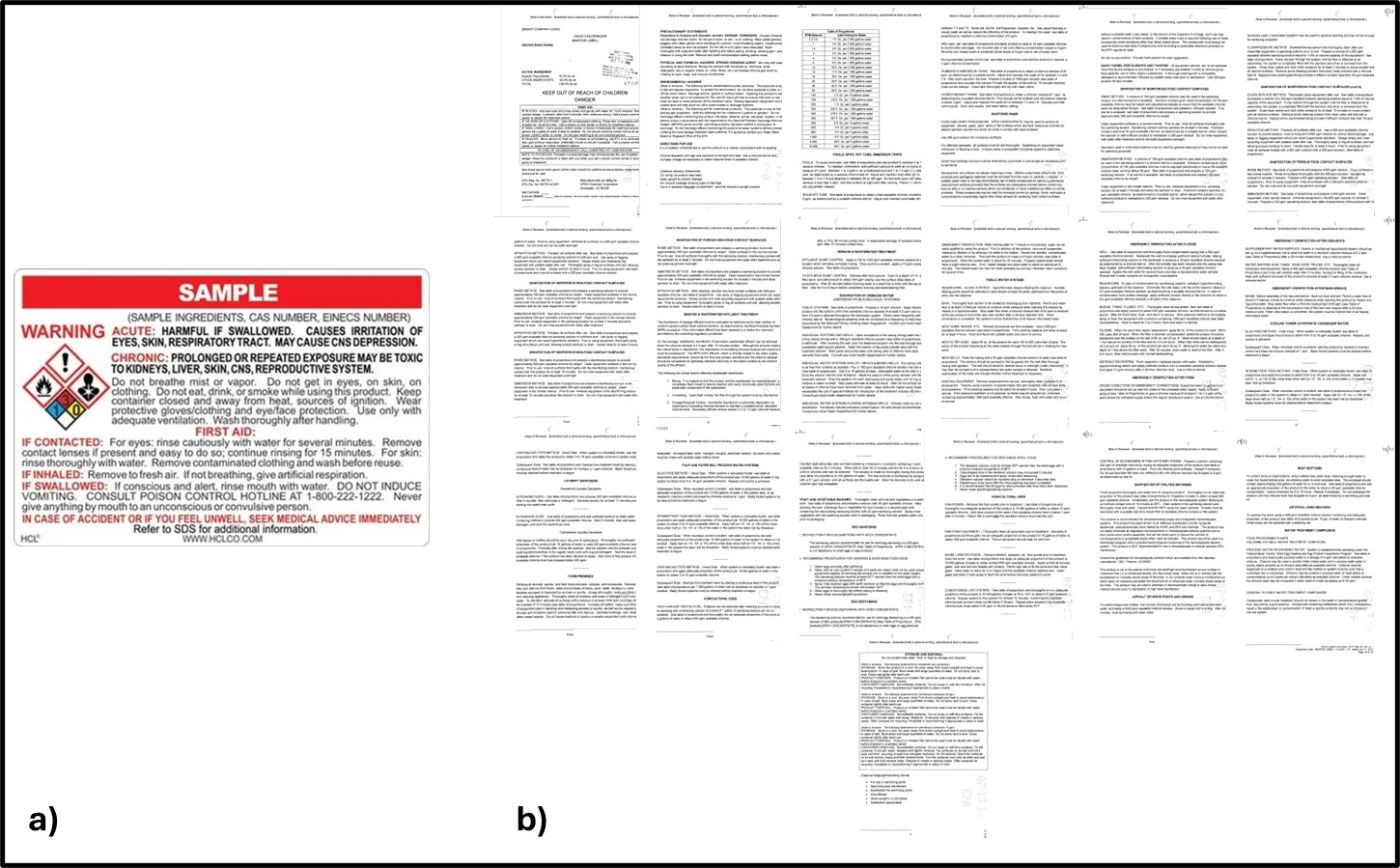
I have a simple proposition. Level the playing field. I suggest that governmental agencies responsible for industrial chemicals revise their regulations so that all industrial chemicals have the same data requirements for approval. Countless industrial chemicals are more toxic than those registered as biocidal products. Currently, the toxicological and environmental data available for many non-biocidal products are substantially more limited than data for biocidal products. Similarly, for a given chemical that has technical and biocidal uses, the amount of information required on a biocidal product’s label is substantially greater than on a technical product’s label (Figure 5).


Fig 5. Product labels for 10 % Sodium Hypochlorite (NaOCl – bleach) – a) label on household bleach bottle; b) master label for 10 % NaOCl as an algicide (22 pages).

Chemical substances’ adverse health effects are typically discovered only years after the general population has been exposed. If all products were required to be supported by the same toxicity and environmental data, manufacturers would lose their incentive to replace approved biocidal products with potentially more toxic substitutes.

Summary

Microbicides are under increasing regulatory pressure. This pressure translates into an increased number of tests requires in support of registration and reregistration applications. The additional tests are substantially more expensive than those run for technical grade chemicals and typically add up to more than $2 million U.S. These costs have a chilling impact against new microbicide development. The greater toxicity testing burden for biocidal products does not reflect either increased exposure risk or chemical hazard. It is based on hysterical reactions to the word biocide. The unintended consequences of this trend will be increased health risks and biodeterioration costs.

I look forward to your thoughts and questions about how industry stakeholders can reverse this shrinking availability of biocidal products. Contact me at fredp@biodeterioration-control.com.

INDUSTRIAL MICROBIOLOGY – WHAT’S CHANGED?


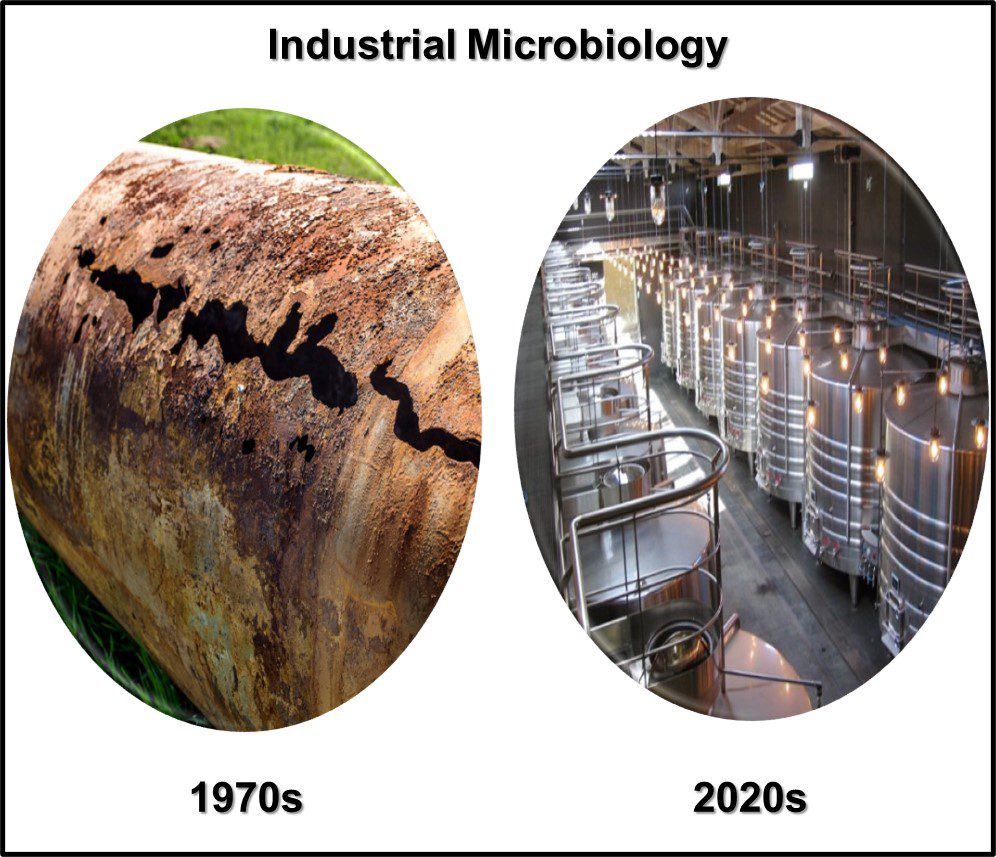
Left Image – microbiologically influenced corrosion of petroleum pipeline; Right Image – industrial scale fermentation.

Introduction

In a recent book chapter (Noha M. Sorour, et al. 2017. Chapter 3 – Microbial Biosynthesis of Health-Promoting Food Ingredients, In: Alexandru Mihai Grumezescu, Alina Maria Holban, Eds, In Handbook of Food Bioengineering, Food Biosynthesis, pp: 25-54, Academic Press, New York, ISBN 9780128113721, https://www.sciencedirect.com/science/article/abs/pii/B9780128113721000038) industrial microbiology was defined as a branch of applied microbiology in which microorganisms are used for the production of important substances, such as antibiotics, food products, enzymes, amino acids, vaccines, and fine chemicals. With respect to the scope, objectives, and activities, industrial microbiology is synonymous with the term fermentation, as fermentation includes any process mediated by or involving microorganisms in which a product of economic value is obtained. There was no mention of microbial contamination control in this definition. I feel as though I missed The Memo.

When I first joined the organization then known as the Society of Industrial Microbiology (SIM; now, Society of Industrial Microbiology and Biotechnology – SIMB), annual meeting sessions largely focused on sessions about different ways that microbes could cause damage to industrial systems. In recent years, sessions on microbial contamination control have largely disappeared from annual meeting programs. What is going on?

Fermentation Art and Science

I don’t mean to suggest that historically, industrial microbiology did not include fermentation. In fact, archeological evidence suggests that the art of fermentation dates nearly as far back as ancient agriculture (i.e., before 10,000 BCE – Figure 1a). Leavened bread and fermented beverages have existed at least as long as written records. During the mid-19th century, Louis Pasteur and Robert Koch, respectively, proved conclusively that microorganisms were responsible for food spoilage and disease. In particular, Pasture championed the marriage of art and science in the world of fermentation (Figure 1b). Since the mid-20th century fermentation process science has expanded to include bioconversion of diverse feed stocks into innumerable products including, but not limited to, foods, flavors, pharmaceuticals, polymers, and solvents (Figure 1c). Fermentation science is now under the moniker biotechnology (the American Chemical Society defines biotechnology as “the application of biological organisms, systems, or processes by various industries to learning about the science of life and the improvement of the value of materials and organisms, such as pharmaceuticals, crops, and livestock.”).


Fig 1. History of fermentation – a) ancient grain collecting and fermentation; b) mid-19th century brewery; c) modern biotechnology facility.

We have come a long way from the earliest attempts to ferment foods as a means of preservation and alcoholic beverage production! Still, I feel that industrial microbiology’s current definition ignores an important aspect of the discipline’s scope – microbiological contamination control.

Microbiological Contamination Control

Biocides ascendant

It has been speculated that the earliest attempts to preserve foods was through fermentation and that kimchi (fermented cabbage) was developed in the 10th century BCE. The earliest recorded use of minerals as biocidal agents was the use of sulfur in ~2,500 BCE. Arsenic, lead, mercury, have been used as antimicrobial control agents since at least the 2nd century BCE. In 1867, Joseph Lister introduced the first organic antimicrobial agent – phenol (Figure 2a) – as an antimicrobial agent to prevent wound sepsis. Subsequently, phenol was used widely as a surface contact disinfectant.

The number of available organic microbicides grew dramatically between the 1930s and 1970s. Early oilfield microbiology research demonstrated that polychlorinated phenols (trichlorophenol and pentachlorophenol) did an excellent job of inhibiting sulfate reducing bacteria from causing problems when water was injected into petroleum formations. From the mid-1940s until their use was banned in the early 1970s, polychlorinated phenols (Figures 2b and 2c) were the predominant oilfield microbicides. Once chlorinated phenols were banned, glutaraldehyde (Figure 2d) and quaternary ammonium compounds (Quats – Figure 2e) became the most used oilfield microbicides. There are now hundreds of quats available for use in various applications. After the development of water-miscible metalworking fluids (MWF), the need for microbicides became apparent. Hexahydro-1,3,5-tris(2-hydroxyethyl)-s-triazine (Figure 2f) and several oxazolidine biocides dominated the application, although, by 1990, nearly 200 active substances for use n MWF were approved by the U.S. EPA. I’m not trying to provide a comprehensive review of organic biocide history here. My point is that, entering into the 1990s, there were many of microbicidal active substances available for use in industrial applications.


Fig 2. Selected organic microbicides – a) phenol; b) trichlorophenol; c) pentachlorophenol; d) glutaraldehyde; e) quaternary ammonium compound (R1 through R4 are organic – CH – radicals, the chemistry of which can vary by chain length, degree of substitution, presence of oxygen, and ring structures); f) Hexahydro-1,3,5-tris(2-hydroxyethyl)-s-triazine.

Biocides descendant

Since the mid-1990s, two factors have contributed to substantially reduce the number of active substances available to use in various industries – regulatory pressure and industry consolidation (Figure 3).


Fig 3. The incredible shrinking list of microbicidal active substances and the factors driving that shrinkage.

First the agencies responsible for biocide regulation have changed. In the U.S., the U.S. Environmental Protection Agency assumed responsibility in the early 1970s. In the EU, the European Chemical Agency’s Biocidal Products Committee was chartered under the 1998 Biocidal Products Directive (Directive 98/8/EC). As I’ve noted above, tri- and pentachlorophenol use was banned in the early 1970s after they were found to be carcinogenic and persistent in the environment. The types of toxicity and environmental fate data needed to support biocidal product registrations, are substantially greater than those needed to register non-biocidal, technical products. The cost of completing a full toxicological evaluation are estimated at $2 U.S. million to >$10 million U.S. For biocides used in niche applications, such as MWF or jet fuel, the addressable market does not justify the expense. Moreover, the timeline between initial registration application and regulatory agency approval can be greater than ten years. In the U.S., after recommending that formaldehyde be found to pose an unreasonable risk, the EPA has targeted formaldehyde-condensate microbicides for special scrutiny. This, despite the fact that the toxicological profiles of formaldehyde-condensate microbicides is substantially different (more benign) than that of formaldehyde and the free-formaldehyde cannot be detected in fluids treated with these active substances.

The second factor is industry consolidation. In 1990, there were numerous microbicide producers in the U.S. and EU. Since then, corporate acquisition has eliminated >90 % of the companies that once produced microbicides. In most cases, the industrial biocide business units represent a negligible fraction of the companies’ annual revenues. In corporations where projects valued at <$100 million U.S. are not supported, new biocidal product development never stands a chance (the total MWF biocide market is estimated at <$300 million U.S.).

Combined, these two factors translate to a greatly reduced list of active substances approved for use in various industrial applications and, in most market sectors, reduced career opportunities for microbiologists.

Old-school industrial microbiology did not focus solely on biocide selection and use. However, controlling microbiological contamination and reducing biodeterioration risk was a primary research objective. Thus the increased regulator pressure against biocide use has also adversely affected this branch of microbial ecology research.

Impact on Old-School Industrial Microbiologists

When I’m asked about my profession, I tell folks that I am an industrial microbial ecologist. I investigate the ecology of microorganisms that infect industrial systems and potentially cause damage to the systems, their contents, or both. There are industrial sectors in which microbial contamination control is still recognized as being a valuable pursuit. For example, there’s a considerable amount of excellent oilfield microbiology research and development. Two international conferences focus on the topic (ISMOS and RMF). Similarly, the Energy Institute has an active Petroleum Microbiology Committee, ASTM has a Fuel Microbiology Working Group, and the International Air Transport Association has a Jet Fuel Microbiology Panel. Conversely, at the STLE 2024 Annual Meeting, I presented the only paper addressing MWF microbiology. Historically, STLE Annual Meeting programs included five to ten papers, presented by representatives of biocide producers, MWF compounders, and MWF end users. Those companies who still have staff microbiologists are not allowing those people to participate in professional society activities. This lack of support in the MWF sector is particularly notable because the tools now available for understanding the microbial ecology of MWF systems promise to provide ways to develop more cost-effective microbial contamination control strategies. Moreover, the potential adverse health effects of uncontrolled microbial contamination have been well documented.

Since 1999, I’ve been teaching MWF microbiology as part of STLE’s education program. I’ve carried on a legacy started by Prof. Ed Bennett (University of Houston) – the individual I consider to be the father of MWF microbiology and the person responsible for initiating educational programs at STLE (then ASLE) annual meetings. Ed was succeeded by another MWF microbiologist (Frank Mallek) and Frank was succeeded by Prof Harold Rossmoore (Wayne State University). After 25 years as an STLE course developer, I’m stepping down. Although I have a successor in mind, I don’t know whether his employer will support his involvement with STLE education. I anticipate that there will be interesting times ahead and that a new generation of industrial microbial ecologists will need to relearn the lessons learned by previous generations.

As always, please share your comments and questions with me at fredp@biodeterioration-control.com.

MICROBIOLOGY FOR THE UNITINTIATED – PART 7: FUNGI


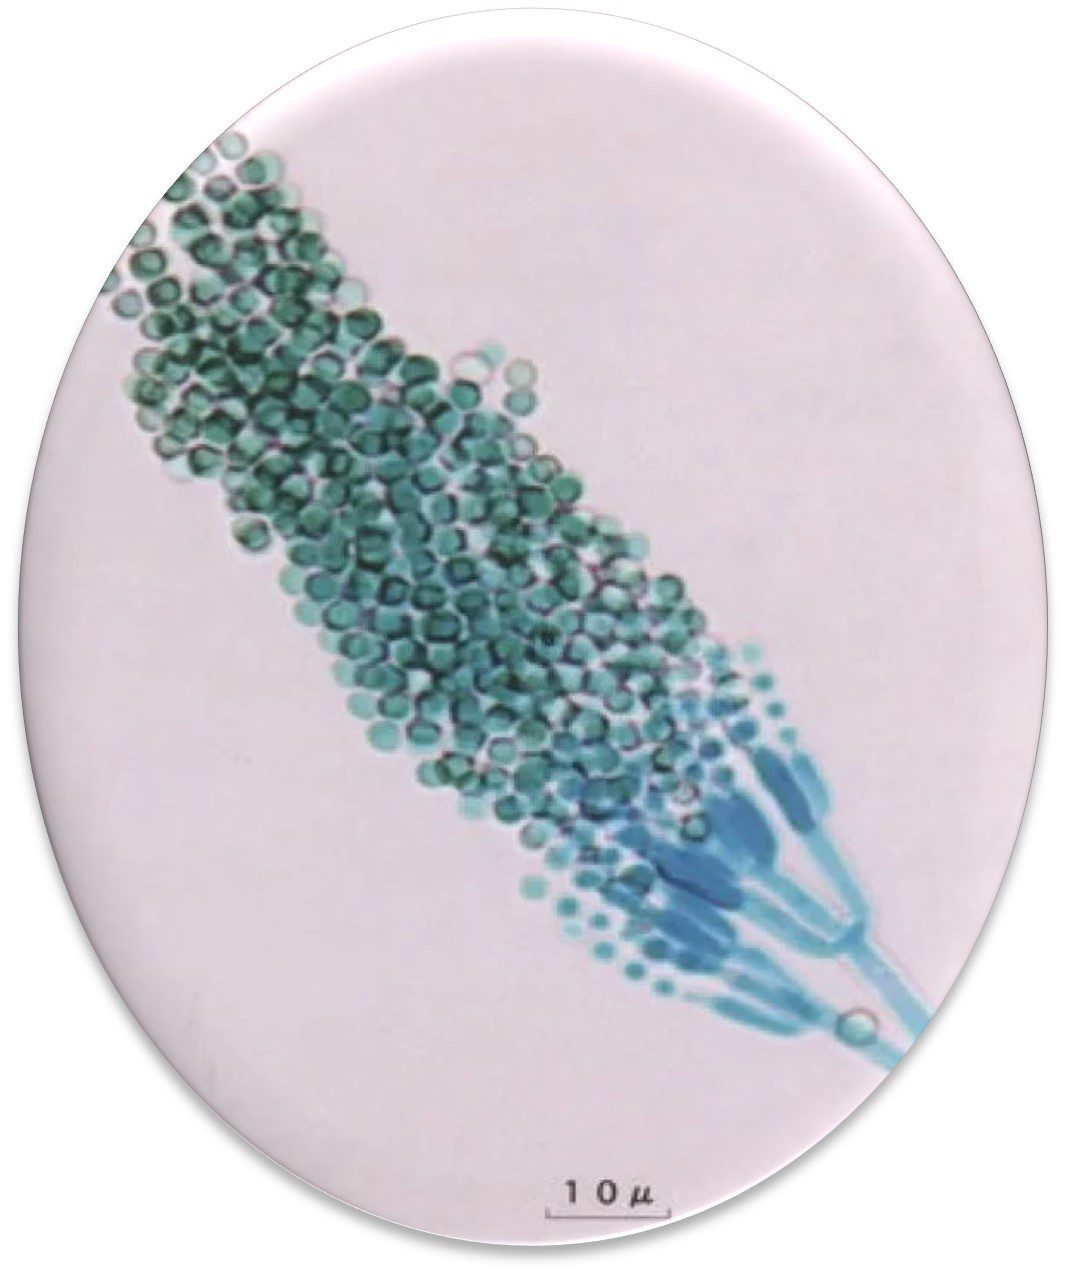
Penicillium citrinum – a common fungal contaminant from water-miscible metalworking fluids. Source: penicillium-citrinum-890c723a-deef-4dea-b2db-de048c4df2a-resize-750.jpg (600×806) (alchetron.com)

Introduction

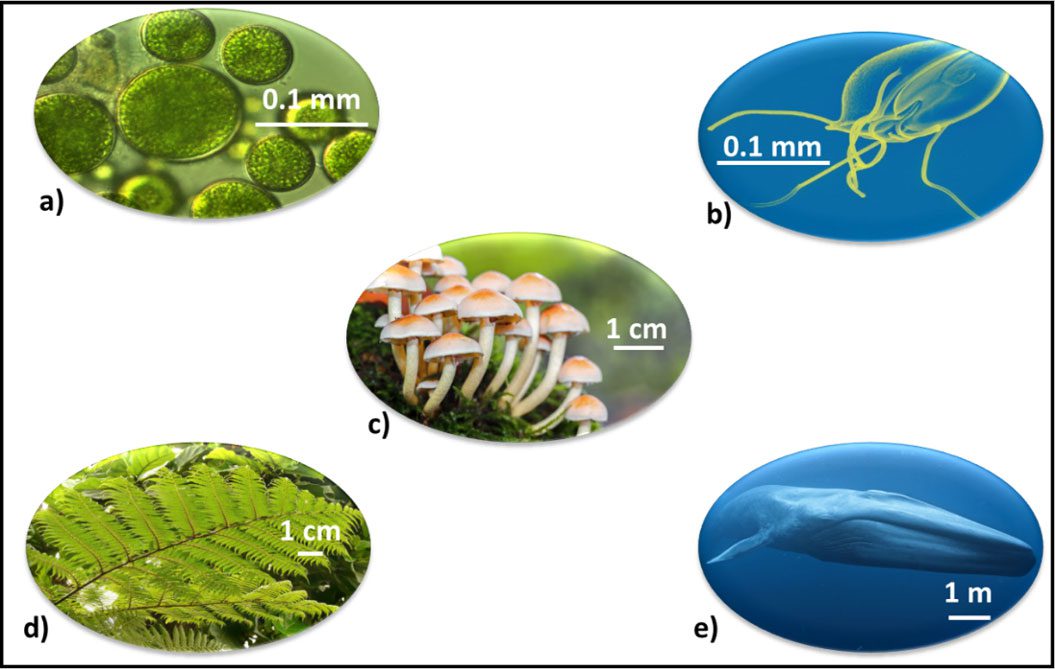
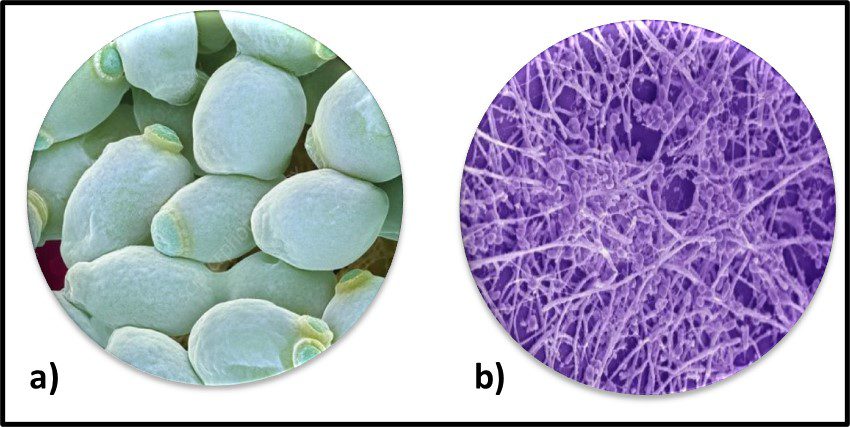
In my September 2023 post, I provided an overview of bacteria the biological domain that includes millions of taxa that share both genetic similarities and an absence of visible internal structures. After a three-month hiatus, I’ll now provide a similar overview of fungi. Fungi is a kingdom of eucaryotic organisms that are members the domain Eucarya. As illustrated in September’s What’s New post, figure 2, Eucarya includes all organisms that have a membrane-bound nucleus. The domain includes organisms ranging in size from single cell algae to 30 m (98 ft) long, 199 metric ton (219 US ton) blue whales (Figure 1). The kingdom Fungi is taxonomically diverse – including yeasts, molds, and mushrooms (Figure 2 – note: yeasts and molds are two different morphologies; not different taxonomic groups). The fungi associated with industrial process fluids are all within the phyla Ascomycota and Mucromycota (recall from September’s post, that phIyla are the tier below kingdoms).

Fungal Taxonomy

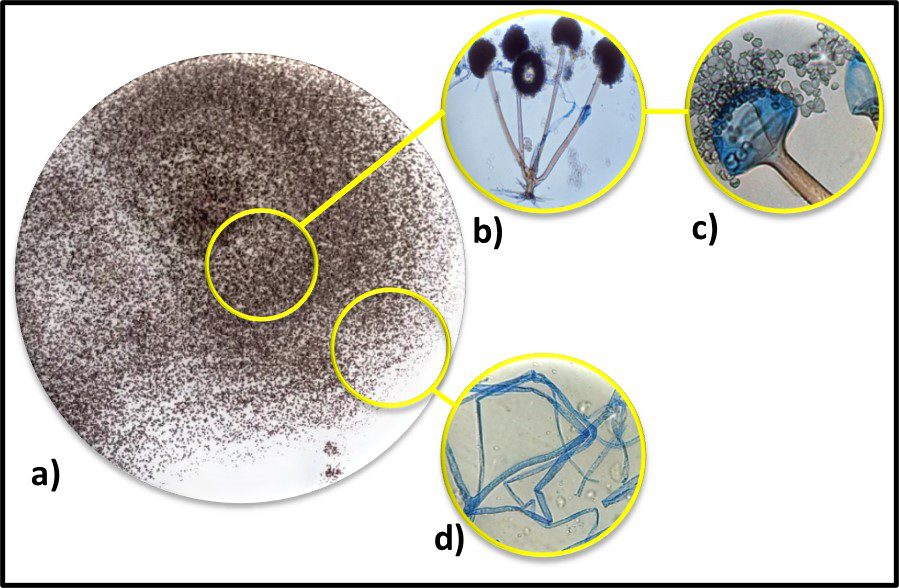
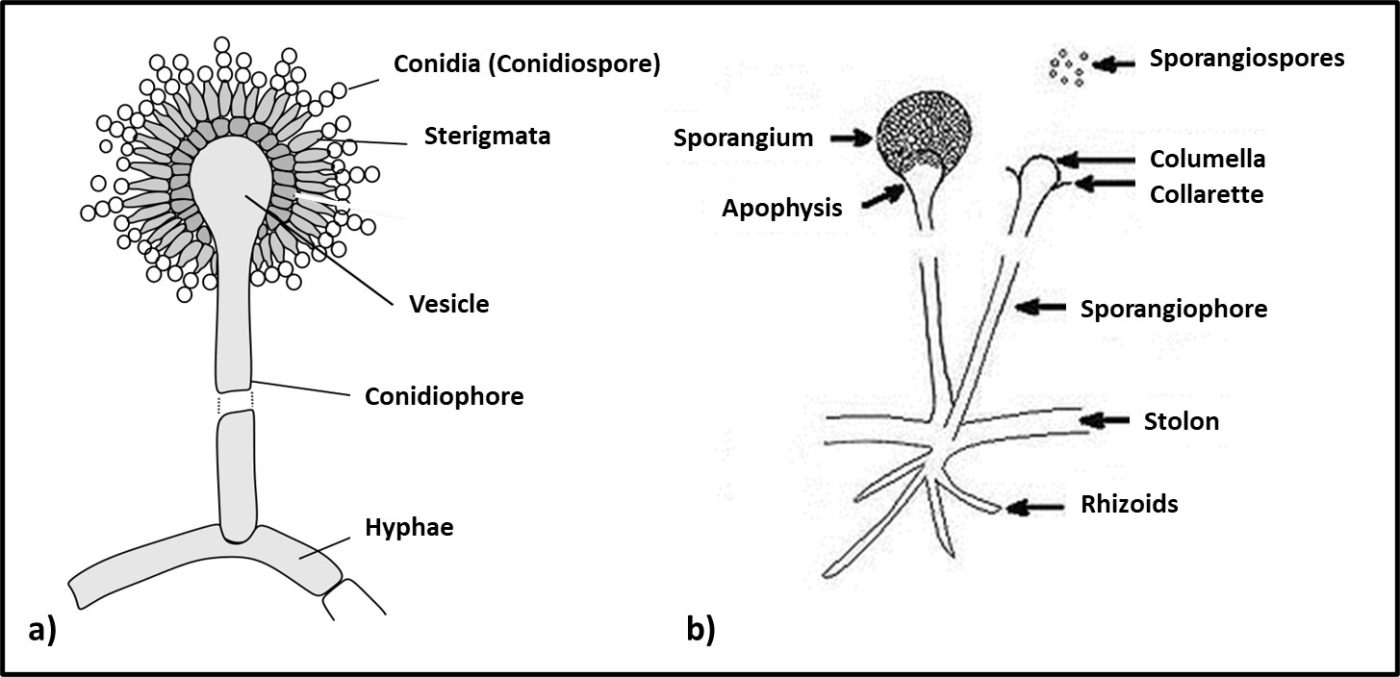
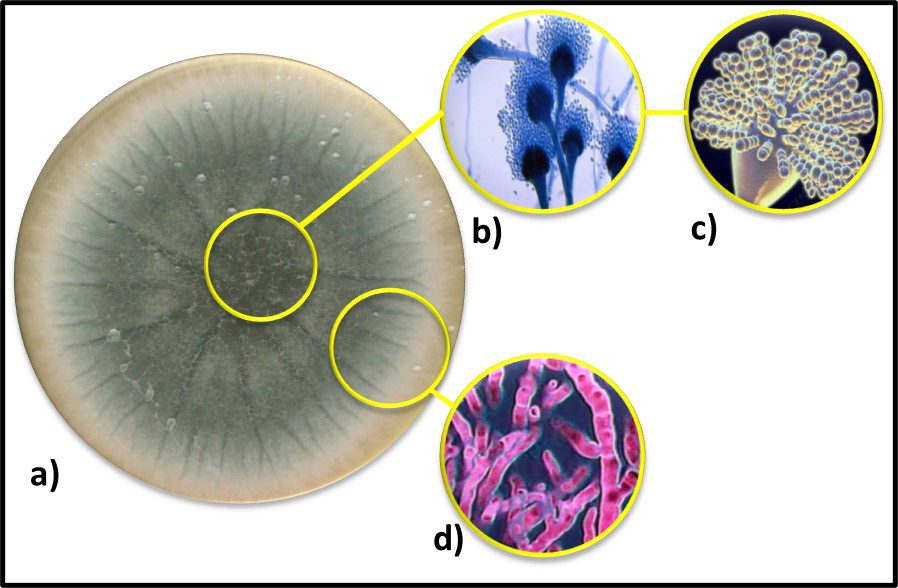
Genera within the phyla Ascomycota (Ascomycetes) and Mucormycota (Zygomycetes) have filamentous, vegetative hyphae and spore-bearing aerial hyphae (Figures 3 and 4). As illustrated in Figure 5, Ascomycota spores are contained in sacs but Mucormycota spores are not. Moreover, some fungal species are dimorphic – they have both filamentous and yeast morphologies (forms – Figure 6). Although historically, fungal taxonomy was based primarily on appearance (morphology) and physiology (eating habits), the discipline is now moving toward genetic classification.


Fig 1. Examples of organisms in the domain Eukarya – a) single-cell alga; b) Giardia sp.; c) fungus (mushroom); d) plant (fern); e) blue whale.


Fig 2. Fungi – a) yeast cells; b) mold cells (filamentous hyphae and aerial spore-bearing bodies}.


Fig 3. Ascomycota – a) Aspergillus fumigatus colony; b) spore-bearing conidiophores; c) close-up of conidiospores on a conidiophore; d) vegetative hyphae.


Fig 4. Mucromycota – a) Rhizopus sp. Colony; b) spore-bearing sporangiophores; c) close-up of a sporangiophore with sporangiospores; d) vegetative rhizoids.


Fig 5. Mold morphology – a) Ascomycota; b) Mucormycota.


Fig 6. Dimorphic fungus Candida albicans – a) yeast form; b) mold form.

Fungus reproduction

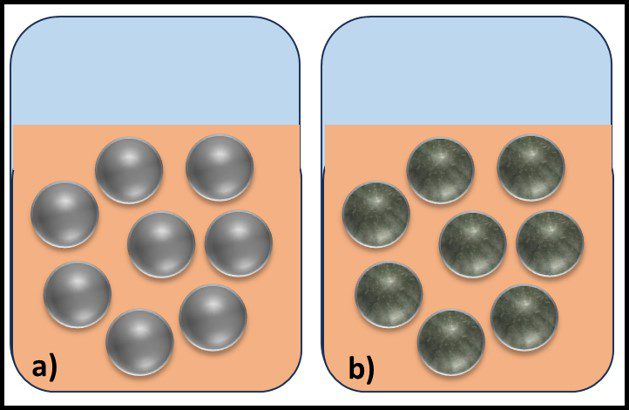
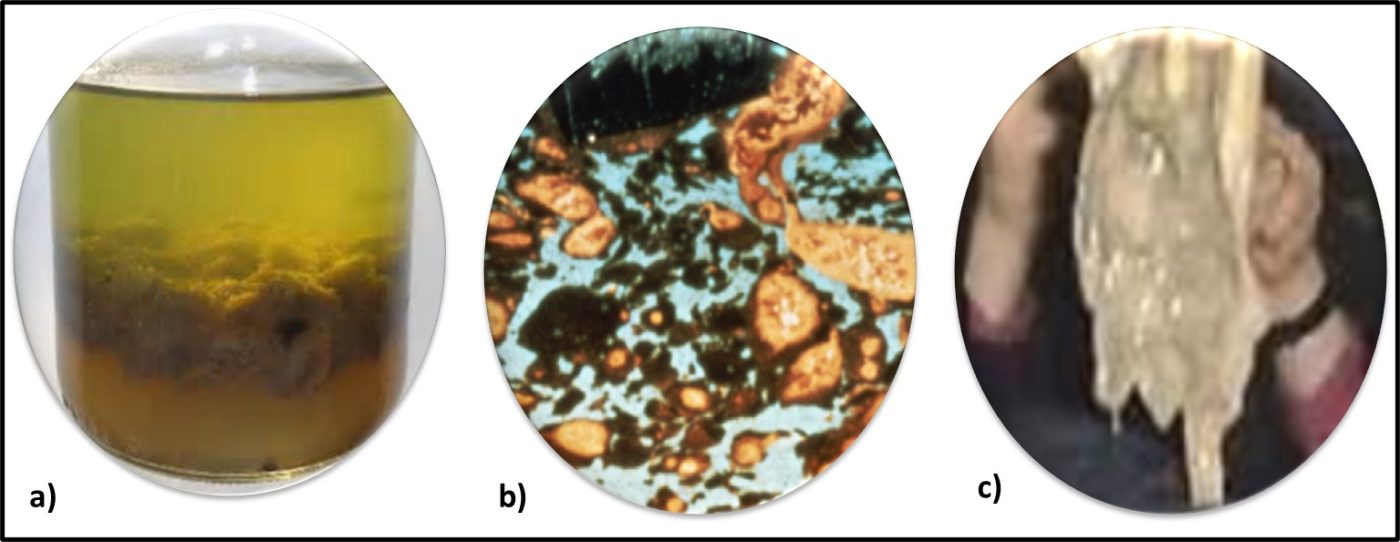
The life cycles of Ascomycetes and Mucoromycetes (Zygomycetes) are similar. As noted above both divisions reproduce sexually and asexually. Spores are formed during asexual reproduction and can persist for centuries until conditions are favorable for germination. Yeasts reproduce by budding (see July 2024, Figure 5). For filamentous forms, most fungal biomass is in the vegetative hyphae. Masses of fungal filaments have been discovered that weigh several metric tons and occupy 1,000s of m3. In liquids such as fuels, lubricants and metalworking fluids, molds typically form spherical colonies. When the aerial hyphae (spore-bearing bodies) develop on the inside of the colony, the spheres are smooth and slimy (Figure 7a – I call these fisheyes). When the areal hyphae develop facing the outside, the spheres are fuzzy (Figure 7b – I call spheres in this form scuzzballs). Fungal growth at the fuel-water interface can form thick, impenetrable masses (Figure 8a). Similar masses can form on MWF system surfaces (Figures 8b and 8c).


Fig 7. Spherical fungal colonies in liquid – a) fisheyes (aerial hyphae are inside of the sphere); b) scuzzballs (areal hyphae are outside the sphere).


Fig 8. Fungal masses in fluid systems – a) fungal mat at fuel-water interface; b) mold colonies on surface of water-miscible metalworking fluid (MWF) in 50 L sump; c) membranous fungal mass pulled off of MWF sluice.

Physiology

In previous posts, I’ve commented that all organisms need water to grow and proliferate. As a kingdom, fungi need less water than bacteria. Water activity (aw is a measure of water’s availability in a solvent). Bacteria typically become dormant when aw ≤0.9. Most fungi can thrive at aw ≥ 0.7. Bacterial grow optimally in the pH 6 to 8 range but fungi prefer pH 5 to 6.

The fungi that infect industrial process fluid systems such as fuel and metalworking fluids can typically proliferate on simple sugars such as glucose. However, many taxa are nutritionally adaptable and can use a variety of organic molecules – including hydrocarbons – as their sole carbon source. Hormoconus resinae, one of the fungal species commonly recovered from fuels, has been shown to degrade ultra-low sulfur diesel (ULSD) by > 60 % (w/w) in < 30 days under laboratory conditions. Degradation includes mineralization to carbon dioxide, partial fuel molecule breakdown (for example aromatics to aliphatics), conversion to new biomass, and metabolism to waste products. There are thousands of volatile, fungal metabolites (MVOC – microbial volatile organic compounds). Many are allergenic – commonly causing sick building syndrome in homes and commercial buildings. Some (e.g., aflatoxin produced by some Aspergillus species) are carcinogenic. Mycotoxins (including hallucinogens) are toxic metabolites produced by fungi. MVOC are primarily associated with fungal spores. Despite the variety of MVOCs, the predominant odors associated with fungal contamination are yeasty or musty (think of a locker room, old damp house, or pile of rotting potatoes). Few studies have investigated MVOC concentrations in industrial facilities. Health and safety studies that have performed at facilities using water-miscible metalworking fluids (MWF) suggest that health risks associated with MVOC exposure do not add significantly to those posed by overall exposure to MWF mist.

Summary

Historically thought to be just one evolutionary step after the bacteria, the domain Fungi is now recognized to be genetically close to plants and animals on the tree of life. Taxonomically and morphologically diverse as a kingdom, the morphological forms that infect industrial systems are yeasts and molds. Because of the masses of filamentous, vegetative hyphae they form, fungi are commonly responsible for plugging lines, filters, and parts washer screens. Fungal MVOC can be noxious, allergenic, toxic, and carcinogenic. Most commonly, fungi are found in multi-organism consortia that include bacteria.

As always, please share your comments and questions with me at fredp@biodeterioration-control.com.

MICROBIOLOGY FOR THE UNITINTIATED – PART 6: BACTERIA


A rod-shaped, polarly flagellated bacterium.
Source: https://factrepublic.com/facts/33765/

Introduction

Now that I’ve provided an overview of the characteristics of all life, I’ll describe the most common types of organisms that contaminate industrial process fluid systems – i.e., oilfield injected and produced waters, fuel-associated waters, heat exchange systems, and countless other systems in which fluids are contained of through which they flow. Historically, the two primary types of microbes recovered from systems not exposed to light are bacteria and fungi. More recently a third group – archaea – have been detected too. When light is present, algae are common contaminants. In this article I’ll discuss bacteria. In future articles I’ll focus on each of the other types of microbes.

The Tree of Life

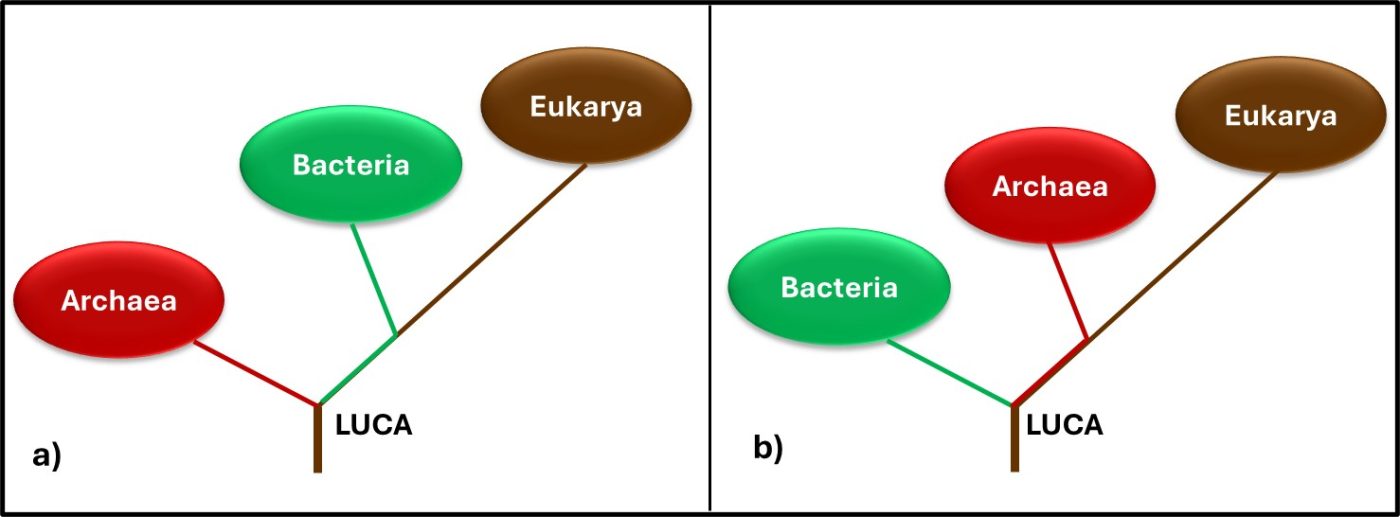
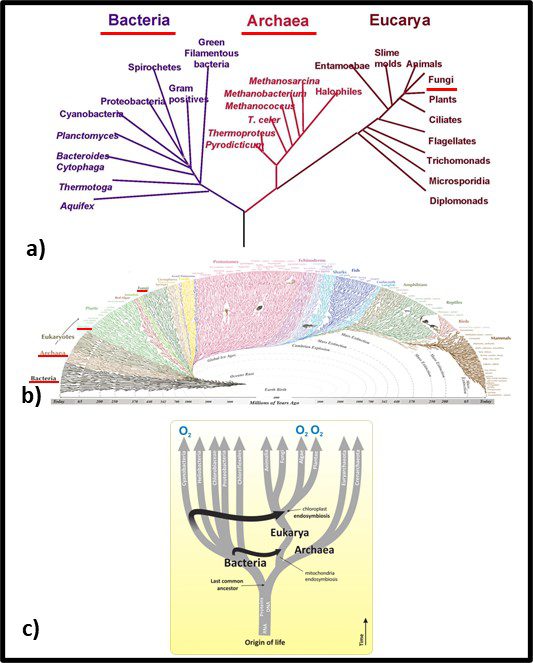
Taxonomy is the science of classifying living things. In 1735, Carl Linnaeus published Systema Naturae in which he described a binomial system for identifying plants (i.e., originally plant and subsequently all organism based on whether they shared or didn’t share a characteristic). Under Linnaean taxonomy, there are eight categorical levels (Figure 1). The highest – most inclusive – level is domain. As illustrated in Figure 3a, there are three domains – Bacteria, Archaea, and Eucarya. Each domain is divided into Phyla. Thus far, the domain Bacteria has approximately 1,300 phyla – with the number still increasing. Phyla are further divided among classes. Again, using Bacteria as our example, the phylum Proteobacteria is comprised of five Classes – Alphaproteobacteria (α-proteobacteria), Betaproteobacteria (β-proteobacteria), Gammaproteobacteria (γ-proteobacteria), Deltaproteobacteria (δ-proteobacteria) and Epsilonproteobacteria ( ε-proteobacteria). The γ-proteobacteria includes 14 Orders which are further divided into 404 Families. For example, the Order Pseudomonadales includes two Families – Moraxellaceae and Pseudomonadaceae – both of which include bacteria commonly recovered from industrial process water systems. Families are comprised of genera (singular – genus). Thus, the genus Pseudomonas is a member of the family Pseudomonadaceae. Traditionally, species was the smallest taxonomic unit (for example Pseudomonas aeruginosa). However, current taxonomic schemes typically include two additional levels – strains and biovariants (abbreviated as biovar.).


Fig 1. Linnaean taxonomy’s eight taxonomic levels.


Fig 2. Phylogenic trees – a) simplified tree showing genetic distances between Bacteria, Archaea, and Fungi; b) more complex genomic map illustrating Bacteria’s emergence approximately 3.2 billion years ago, Archaea’s emergence approximately 1.5 billion years ago, and fungi arriving at approximately the same time as vascular plants – approximately 1 billion years ago. Sources: a) Carreón, Gustavo & Hernández-Zavaleta, Jesús Enrique & Miramontes, Pedro. (2005). DNA Circular Game of Chaos. 757. 10.1063/1.1900503, b) https://i.pinimg.com/originals/46/28/92/46289232f53138d4134ea0e829589d09.gif, c) https://organismalbio.biosci.gatech.edu/biodiversity/eukaryotes-and-their-origins/.

In traditional taxonomy – including microbial taxonomy – organisms were clustered based on their observable similarities. Thus, members of a genus share more characteristics than members of a family. Diversity increases with the classification level. Currently, microbial taxonomists estimate there are at least a billion bacterial species, of which fewer than 10,000 have been characterized (that’s <0.001 % in case you are wondering). Figure 1b offers a visual perspective on the diversity of bacterial life. The black, web-like region on the bottom left reflects the genetic branching since bacteria first existed – an estimated 3.2 billion years ago (the Earth’s estimated age is 4 billion years). I don’t expect readers to use Figure 2b as anything more than an illustration of just how divers the kingdom Bacteria is. Figure 1c provides a simplified tree showing first the evolution of eukaryotes as hosts for bacteria and second the similar age of the Archaea and Eukaryote domains. Figure 3c also illustrates how genetic material (ribonucleic acid – RNA, deoxyribonucleic acid – RNA, and proteins were probably components of self-replicating proto-microbes before the last universal common ancestor (LUCA). Based on genomic analyses, the LUCA is estimated to have existed between 3.48 and 4.1 billion years ago – soon after Earth formed. Although the term LUCA suggests that there was a single genetic entity from which all subsequent life evolved, it is more likely that numerous types of protomicrobes developed and the most successful continued to evolve.

What are Bacteria?

ASTM provides a good working definition. A bacterium is any member “of a class of microscopic single-celled organisms reproducing by fission or by spores. Characterized by round, rod-like, spiral, or filamentous bodies, often aggregated into colonies or mobile by means of flagella. Widely dispersed in soil, water, organic matter, and the bodies of plants and animals. Either autotrophic (self-sustaining, self-generative), saprophytic (derives nutrition from nonliving organic material already present in the environment), or parasitic (deriving nutrition from another living organism).” I discussed bacterial reproduction in July 2023.

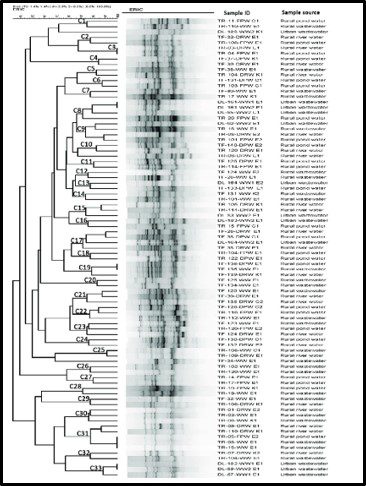
By current estimates, Bacteria are the most diverse organisms. To paraphrase Donald Rumsfeld’s “Known knowns” comment, bacterial diversity and total biomass estimates fall into the category of known unknowns. Figure 3 illustrates a typical dendogram created from DNA data from a soil sample. The dendrogram’s branches represent genetic similarities, with similarities between two DNA molecules increasing as the dendogram branches from left to right. Most commonly, the individual organism type – operational taxonomic units (OTU) are identified only by alphanumeric codes. This is because only a small percentage of bacterial OTU that have been detected by genomic profiling have been identified at the Family, Genus, or Species levels. During the past decade, some researchers have suggested that apparent similarities among DNA molecules based on their migration through an electric field gel (denaturing gradient gel electrophoresis – DGGE – see the black bands in the center of Figure 3) is misleading. DNA molecules with different genes can appear to be common OTUs. Some have argued the amplicon sequence variant (ASV) is more precise. Repeating my mantra, I make this point only to illustrate my point about bacterial diversity. As I explained in my July 1018 What’s New article, unlike antibiotics which are designed to kill specific microbes without damaging surrounding human cells (or microbes that are essential for good health), industrial microbicides typically target a broad spectrum of microbes. My favorite analogy is Bambi v. Godzilla (Figure 4). Full taxonomic profiles can be useful to understand the microbial ecology of the system under investigation, but is unlikely to inform contamination control decisions.


Fig 3. Dendogram of genomic profile of bacteria recovered form water samples. Source: https://journals.plos.org/plosone/article?id=10.1371/journal.pone.0261970


Fig 4. Bambi versus Godzilla (Source: 1969 animated feature – https://www.indiewire.com/2015/01/a-bambi-meets-godzilla-live-action-remake-123687/#!)

Classifying Bacteria

Shape

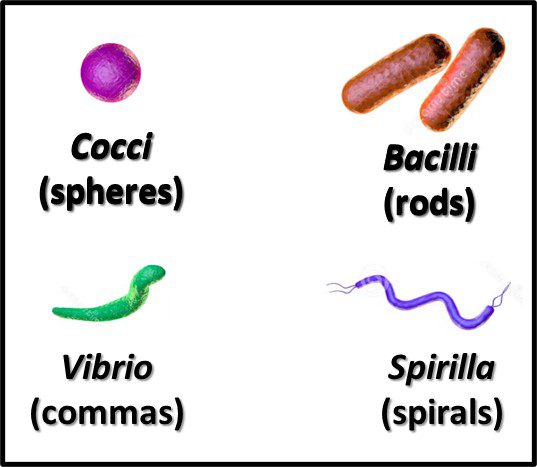
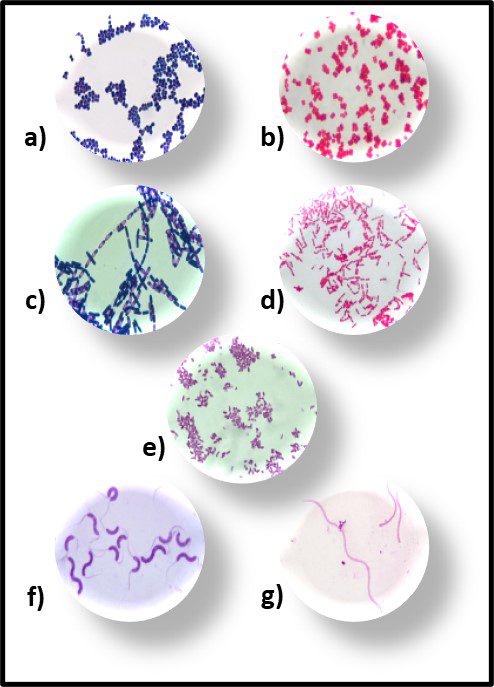
Recognizing that the microscope was the first tool use to detect and identify bacteria, the earliest taxonomic schemes were based on their appearance (morphology). With variations within each group, the primary forms are rod, spheres, commas, and spirals (Figure 5). Once the Gram stain – developed by Hans Christian Gram – was able to differentiate between bacteria with cell walls thet retained an iodine-based stain and those that didn’t – bacteria in each of the morphological groups were classified as being either Gram positive (Figure 6a) or Gram negative (Figure 6b).


Fig 5. Primary bacterial morphologies.


Fig 6. Primary bacterial morphologies after Gram staining – a) Gram positive rods; b) Gram negative rods; c) Gram positive spheres; d) gram negative spheres; e) Gram negative commas; f) Gram positive spirals; and g) Gram negative spirals.

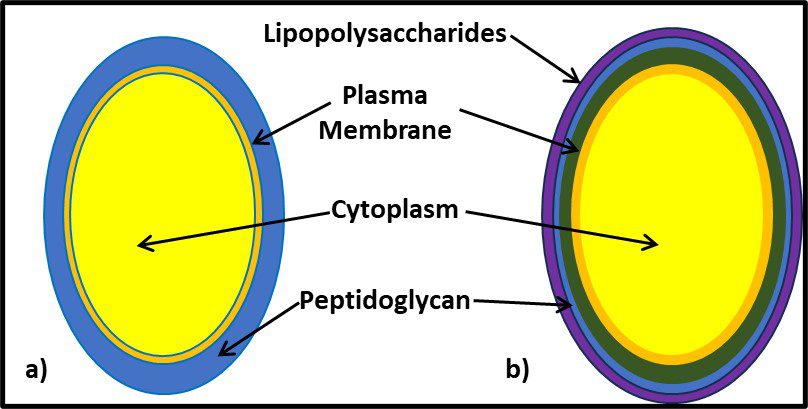
It would be decades before the biochemical basis for Gram positive and Gram negative reactions were understood. As illustrated in Figure 7, the Gram positive cell walls are structurally less complex from those of Gram negative bacteria. The largely carbohydrate Gram positive cell wall retains the iodine stain. The peptidoglycan structure of Gram negative cells do not. Other groups of microbes have subsequently been classified based on their reactions to specific stains (acid fast stain, spore stain, etc.).


Fig 7. Cell wall structure – a) Gram positive cell (mostly peptidoglycan); b) Gram negative cell (the cell wall is substantially more complex; the peptidoglycan layer is covered by a lipopolysaccharide layer).

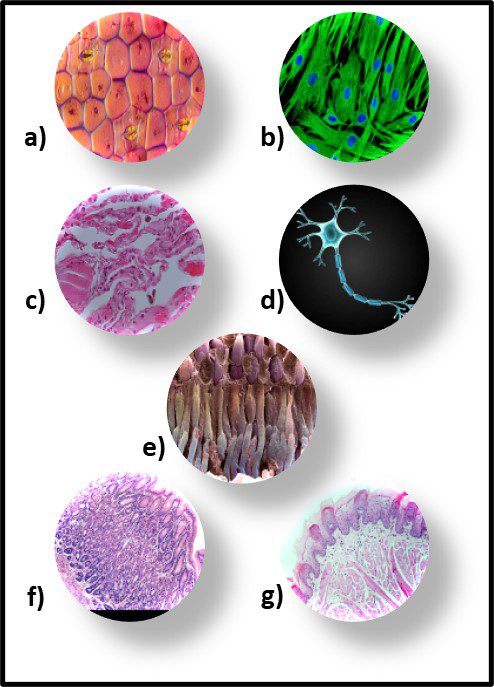
Although morphology can be a useful tool, it is limited due to bacterial pleomorphism – the ability of a specific microbe’s shape to change in response to its environment. More that 20 years ago, researchers at University of Montana’s Center for Biofilm Engineering demonstrated that during biofilm development both the morphology and physiology of genetically identical cells varied, depending on where cells were located within the biofilm matrix. I’m not sure why this was such a startling discovery. Just consider the morphological and physiological diversity of human cells, depending on where they are in (or on our bodies – Figure 8).


Fig 8. Human tissue cells – a) epidermis (skin); b) hair follicle cells; c) lung cells; d) nerve cell; e) retinal cells; f) stomach cells; g) tongue cells.

Physiology

Before genetic testing became affordable and readily accessible, physiological tests were the primary tool – after morphology – to identify microbes. Physiological testing profiles a microbe’s ability to utilize specific nutrients (e.g., glucose or other sugars, various amino acids, hydrocarbons, etc.), produce characteristic metabolites (e.g., ethanol, acetic acid, various gases, etc.), or grow under particular conditions (e.g., oxic or anoxic; acidic, neutral, or alkaline; cold, temperate or hot; etc.). A full battery of physiological tests can include more than 400 different conditions. Traditional microbiological taxonomy standards (for example, Bergey’s Manual of Determinative Bacteriology – nine editions published between 1923 and 1994 – was long considered to be the bible for bacterial identification).

One underappreciated limitation of physiological testing is that these tests could only be run on microbes that could be cultivated in the first place. Moreover, the physiological capabilities of a pure culture can vary with the culture’s age. Consequently, cultures are subject to misidentification due to the variations in their physiological properties as a function of age. I one project, I sent specimens from a single colony to several different labs. Although all the labs used the same automated physiological testing equipment, each lab reported different identities for the culture. When specimens of the same culture were sent to several labs for genetic testing, all identified the microbe correctly.

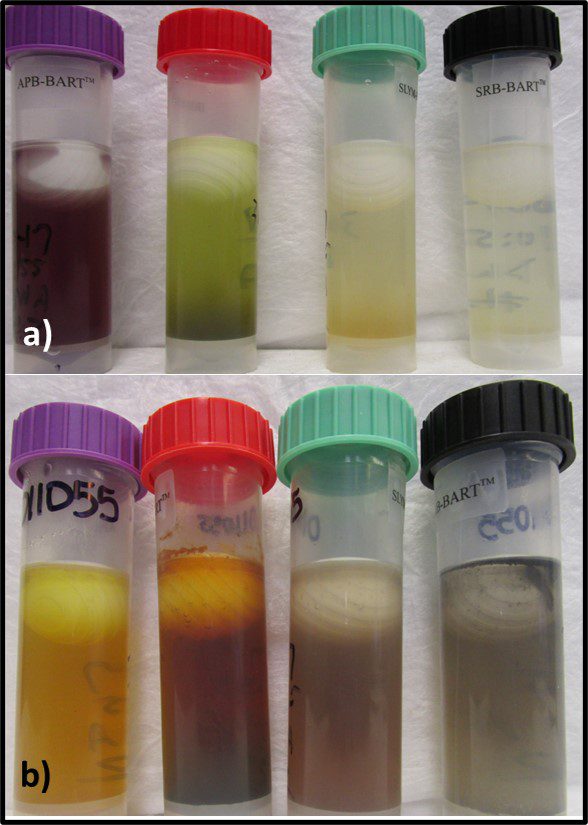
That said, grouping microbes into physiological classes to assess biodeterioration risk can be useful. I routinely run BART™ (BART – Biological Activity Reaction Test – is a trademark of Droycon Bioconcepts, Inc., Regina, Canada) tests on fuel or fuel-associated water samples that have high ATP-bioburdens. BART vials each contain one of nine different dried media. I typically test for acid producing bacteria (APB), iron related bacteria (IRB), denitrifying bacteria (DN), nitrifying bacteria (NB), slime-forming bacteria (SLYM), and sulfate reducing bacteria (SRB) – microbes commonly associated with microbiologically influenced corrosion. Figure 9 illustrates the reactions in APB, IRB, SLYM, and SRB BART vials inoculated from fuel-associated water.


Fig 9. BART (left to right) APB, IRB, SLYM, and SRB vials inoculated with fuel-associated water – a) Immediately after inoculation; b) after 4-days incubation. The sample was positive for all four metabolic groups.

Figure 9a shows the vials’ appearances immediately after inoculation. Figure 9b shows how each vial changed color and became turbid after four-days’ incubation. The microbes growing in each vial represented diverse types of individual taxa that shared a physiological property – i.e., acid production, etc.

Similarly, representatives from diverse taxa are included in each respiration and fermentation category (see August 2023). Classifying microbes based on their ecologically important physiological properties is like classifying trades people based on their skills – carpenters, electricians, plumbers, welders, etc. It provides no indication of their family lineages.

Optimal and Tolerated Growth Conditions

Just as genetically diverse microbes fall into different physiological categories, they also fall into different growth condition categories. Here, I’m using growth condition to include environmental factors such as temperature, pH, and salinity.

Temperature

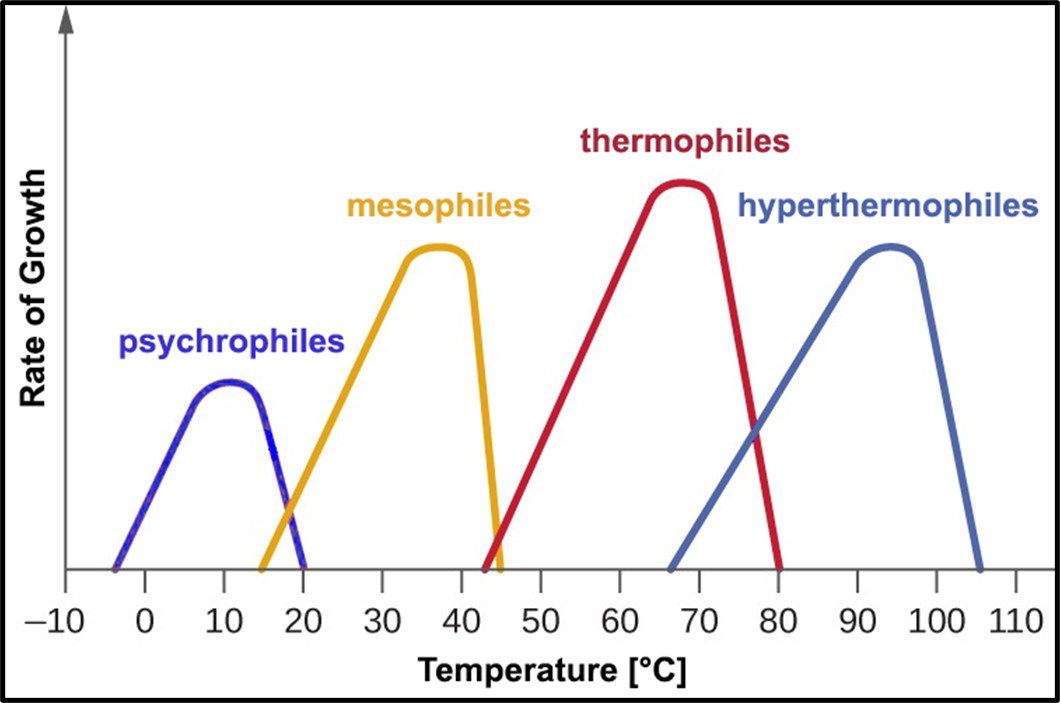
Psychrophilic bacteria grow optimally at temperatures between 10 °C and 15 °C. Most will not grow at temperatures >20 °C. Mesophiles – the microbes most commonly associated with disease – require moderate temperatures in the 20 °C to 40 °C range. Most bacteria isolated from fuel and industrial process fluid systems where temperatures are typically <45 °C are mesophilic. Thermophiles require hotter temperatures (≥45 °C). Thermophiles have been recovered from environments where the temperature is >100 °C. Figure 10 illustrates how microbes are classified based on the temperature range in which they will grow.


Fig 10. Microbe classification by optimal and tolerated temperatures.

pH

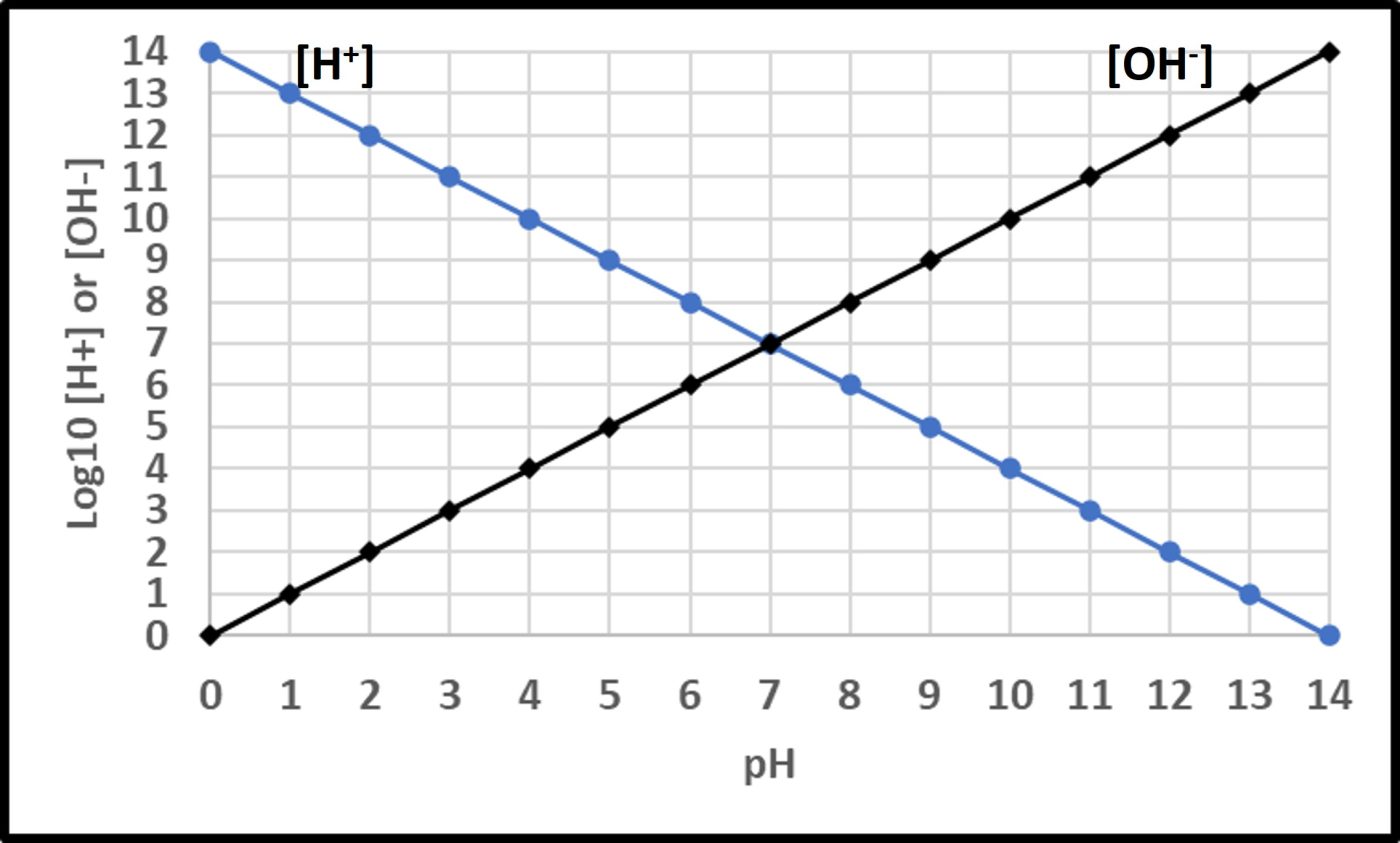
The Mirriam-Webster online dictionary defines pH as “a measure of acidity and alkalinity of a solution that is a number on a scale on which a value of 7 represents neutrality and lower numbers indicate increasing acidity and higher numbers increasing alkalinity and on which each unit of change represents a tenfold change in acidity or alkalinity and that is the negative logarithm of the effective hydrogen-ion concentration or hydrogen-ion activity in gram equivalents per liter of the solution.” Mathematically,

pH = -Log10 [H+]

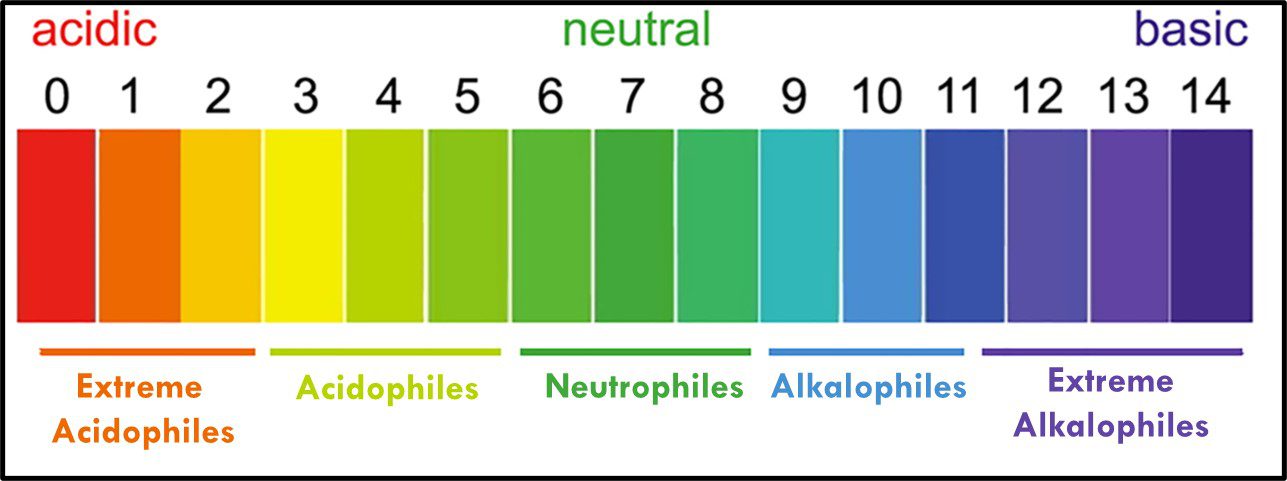
Where “p” is a term with an interesting history (which I won’t share here). In water, the fractional sum of hydrogen (H+) and hydroxide (OH) ions is always 1. As shown in Figure 11, pH decreases as Log10 [H+] increases. At neutral pH, Log10 [H+] = Log10 [OH]. Neutrophiles only grow when the in the pH range 7 ± 1.5. Acidophiles thrive at lower pHs. Some (extreme acidophiles) grow in water with pH = 1. Conversely, alkalinophiles require pH ≥ 9 (Figure 12).


Fig 11. Relationships between hydrogen ([H+] and hydroxyl ([OH]) ions and pH.


Fig 12. Microbe classification by optimal and tolerated pH ranges.

Other environmental conditions

Microbes can also be classified based on their preference (i.e., condition for optimal or maximal growth) for atmospheric pressure (barophiles only grow in environments with pressures ≥ 10,000 kPa (100x atmospheric pressure, and vacuumphiles grow in environments with pressures in the 5 kPa to 15 kPa range – 0.05x to 0.14x atmospheric pressure), osmotic pressure, salinity, radiation, or other factors that span ranges that select for different microbes at different requins of the parameter’s range. Organisms that prefer life at the high or low ends of each factor are called extremophiles. Some types of microbes enjoy environments that are extreme by more than one criterion. For example, microbes thriving around deep-sea ocean vents are thermophilic barophiles. They require both high temperatures and pressures.

Most higher life forms can tolerate only a narrow (in Goldilocks terms – just right) range of each of these factors. Bacteria and archaea are unique in the range of environmental conditions they enjoy as kingdoms. However, individual taxa are limited in the range of environments in which they can thrive. Still each time a group of scientists report they have discovered an environment on Earth that is completely devoid of life, they are proven wrong. The development of genetic testing has made it possible to detect bacteria and archaea (more on archaea in my next article) that had previously been undetectable. Regarding the ability of one or more life forms to exist in Earth’s most hostile environments, Carl Sagan’s adage – “The absence of evidence is not evidence of absence” – has been proven true. Of course, Professor Sagan was referring to life beyond earth. We will have to wait and see on that front.

Summary

The domain Bacteria is genetically the most ancient and diverse of the three domains into which all life on earth is divided. To date, microbiologists estimate that we have detected <0.001 % of the different types of bacteria thought to exist in nature. Although the tools used to traditionally identify bacteria are still of some value, genomic test methods have changed the game. Microbes that once seemed to be closely related, based on their appearance and nutritional characteristics (physiology) have been shown to be genetically distant. Conversely, other microbes, once thought to be dissimilar are now known to be close genetic relatives. Because of their ecological and physiological diversity, bacteria play major roles in biotransformation processes (I’ll write about nutrient cycles in future What’s New articles). When biotransformation causes damage, we call it biodeterioration. When it is used to produce useful products, we call it biotechnology, and when it facilitates remediation, we call it bioremediation. We need to remember that microbes live their lives unaware of the labels we humans apply to their activities.

In this article I have barely scratched bacteriology’s surface. Quite often clients ask me to provide them with a list of microbes present in a contaminated system. I invariably ask what they will do with that information. In my opinion, the art and science of microbial contamination control depends on understanding what the population is doing rather than identifying taxonomic names. What do you think? As always, please share your comments and questions with me at fredp@biodeterioration-control.com.

STLE’S TRIBOLOGY & LUBRICATION TECHNOLOGY JUNE 2023 ISSUE SOUNDING BOARD


Bacteria
Source: BACTERIA – Bing images

June TLT Sounding Board Question 1: “Do you think that biolubricants are more sensitive to microbiological attacks?”

In Talmudic style, my response to that question is another question: is biolubricant susceptibility to microbial attack – i.e., biodeterioration – a matter of conjecture?! Most of the respondents apparently thought so. However, one responded: “Depends on the composition and overall resistance to microbial attack. I would imagine testing on microbial resistance would be part of the testing for new products.” This individual chose not to take the bait. They recognized that “sensitivity to microbial attack” depended on the finished stock’s chemistry rather than its source.

Having it both ways?

As ASTM D8324 Standard Guide for Selection of Environmentally Acceptable Lubricants for the U.S. Environmental Protection Agency (EPA) Vessel General Permit points out, the concept of an environmentally acceptable lubricant (EAL) aligns with Humpty Dumpty’s comment: “When I use a word,’ Humpty Dumpty said in rather a scornful tone, ‘it means just what I choose it to mean — neither more nor less.’” Figure 1’s exchange between Humpty Dumpty and Alice is relevant for several reasons.

1. There are numerous EAL labels and the criteria for each label is unique. Germany’s Blue Angel, EU’s Ecolabel US EPA’s EAL, respective criteria are similar but different criteria. Thus, the concept of what defines an environmentally friendly lubricant is a matter of debate.

2. Alice’s response is a question all too commonly asked by marketers. One common trope among companies selling water-miscible metalworking fluids (MWF) is the claim that their product is “biocide-free” when it most likely contains an unregistered component that’s more toxic than most registered biocides (see What’s New, February 2022).


Fig 1. Humpty Dumpty’s perspective on definitions.

3. Humpty Dumpty’s retort is again relevant to the extent that folks can use meaningless generalizations to support any point of view. The fact is that biolubricant biodegradability can and has been tested.

Lubricant marketers want to be able to claim that their products are environmentally acceptable, but are considerably less enthusiastic about also claiming that readily biodegradable products are – well – also readily susceptible to biodeterioration.

Biodegradability testing

All of the environmental label issuers require biodegradability testing. Typically testing is performed in accordance with Organisation for Economic Co-operation and Development (OECD) Test 301 OECD Guideline for Testing of Chemicals – Ready Biodegradability. OECD 301 has a number of variants – 301A through 301F. As illustrated in Figure 2, the first step is to determine a product’s partition coefficient (OECD 117). If the product’s n-octanol/water partition coefficient – POW (POW = ; Log POW = KOW) – is in the ≤3 KOW ≤ 7 range, then the substance is potentially bioaccumulative. Bioaccumulative substances are those that can be captured irreversibly in the tissues of various organisms. When KOW is in the 3 to 7 range, the next step is to test for biodegradability. Lubricants are biodegradable if > 95 % (w/w) of the formulation is biodegradable (>70 % of each molecular species is mineralized within 28 days). If >5 % of the formulation is not biodegradable, the product is then tested in accordance with OECD 305 Bioaccumulation in Fish. The key points here are:

1. Biobased feed stocks and lubricants can readily be tested for their partition coefficient, and

2. If KOW is in the 3 to 7 range, the lubricant’s water accommodated fraction can be further tested for biodegradability.

There is no need to speculate about biobased lubricant biodegradability (i.e., susceptibility to microbiological attack). The OECD test methods are standardized, making it possible to compare how readily any finished lubricant or lubricant stock might be.


Fig 2. A very simplified flow chart for assessing lubricant or lubricant base stock biodegradability and bioaccumulative properties.

Keep in mind that if there is no water present, then neither lubricants nor base stocks – regardless of their chemistry – will be susceptible to microbiological attack. Similarly, if none of the lubricant or base stock partitions into the aqueous phase when water is present, it is not going to be susceptible to microbiological attack.

Here’s the having it both ways conundrum: by definition, the more biodegradable a substance by OECD 301, the more susceptible it is to microbiological attack. Ecological good news is necessarily operational bad news unless you keep water out of the lubricating system!

Are all biobased stocks equal?

Fatty acid methyl ester (FAME) is used to blend biodiesel fuels. Consequently, FAME biodegradation susceptibility has been studied quite extensively. It is not unreasonable to use FAME biodegradation knowledge as a starting point to speculate about biolubricant basestock resistance to microbial attack.

Generally speaking, biodegradability inversely related to oxidative stability. The primary factors affecting both oxidative stability and bioresistance are carbon chain length and saturation. FAMEs with shorter chain length (i.e., <C 15) tend to be more biologically and oxidatively stable than those with chain lengths > C15. Also, saturated molecules (i.e., those with no carbon-carbon double bonds – C=C) are more stable than mono- or polyunsaturated carbon chains (Figure 3). Note, for example that coconut FAME (C12-C14; >85 % saturated) is quite stable. It is even used as a topical antimicrobial agent. Conversely soy and canola FAME (are composed of primarily C16-C18 and C24-C26 mono- and polyunsaturated acids – soy is ~14 % saturated and ~canola is 5 % saturated). Both are readily biodegradable.


Fig 3. Relative biodegradability of selected biobased oils and fatty acid methyl esters.

Summary

Biobased lubricants and lubricant stock susceptibility to biodegradation should not be assessed by polling. As my friend and STLE Metalworking Fluid Education Committee colleague John Burke frequently observes, “without data, you are just another person with an opinion.” Everybody has an opinion, but objective data are relatively easy to develop. The question should have been the basis of a research effort rather than an opinion poll.

What do you think? As always, please share your comments and questions with me at fredp@biodeterioration-control.com.

MICROBIOLOGY FOR THE UNITINTIATED – PART 5: MICROBIAL RESPIRATION


Tree of life

All Organisms Share Common Characteristics

As I explained in April’s column, all life forms share at least six common properties (variations of this list that include additional properties):

  • Order
  • Growth
  • Homeostasis
  • Metabolism
  • Reproduction
  • Respiration

In April I focused on order and growth. In May I covered homeostasis and metabolism and in July, reproduction. In this month’s article I will focus on respiration.

Respiration

Respiration is the three-step (note: here I am using step to indicate a group of biochemical reactions, not a single reaction) each metabolic process by which non-photosynthetic cells obtain (conserve) energy. In oxic (oxic – an environment in which oxygen is present) environments aerobic respiration is the primary energy producing process. In anoxic (anoxic – in environment in which oxygen is absent or at a concentration too low to support aerobic metabolism) environments anaerobic respiration or fermentation occur. Fermentation is a form of energy metabolism that does not involve the electron transport chain (ETC). Figure 1 illustrates these three forms of energy metabolism. For aerobic respiration, oxygen (O2) serves as the electron transport chain’s (ETC’s) terminal electron acceptor. For anaerobic respiration, alternative inorganic molecules (for example, carbon dioxide (CO2), nitrate (NO3), nitrite (NO2), iron (Fe3+), manganese (Mn4+), sulfate (SO42-), sulfur (S0), etc.) serve as the ETC’s terminal electron acceptor.


Fig 1. Respriation – all respiration pathways begin with glycolysis.

Respiration Pathways

Step 1Glycolysis is the metabolism of glucose to pyruvate (Figure 2). Each 6-carbon (C6) glucose molecule is catabolized (broken down) to two C3 pyruvate molecules. This pathway generates 8 adenosine triphosphate (ATP) molecules (remember that ATP is the primary energy molecule in all cells).


Fig 2. Glycolysis – Note the role of ATP and the net generation of 2 ATP molecules per glucose molecule.

Nicotinamide adenine dinucleotide (NAD+ and NADH) plays a key role in electron transfer. The reversable electron transfer between NAD+ and NADH (NAD+ + e ↔ NADH) drives oxidative phosphorylation (ADP + PO4 → ATP). As we will see below, flavin adenosine dinucleotide (FAD+ and FADH2) play a similar role to NAD+ and NADH in the ETC.

Step 2 – As illustrated in Figure 3, pyruvate is metabolized via the Krebs Cycle (also known as the Citric Acid Cycle or Tricarboxylic Acid Cycle). The Krebs Cycle can theoretically generate an additional 24 ATP molecules.


Fig 3. The Krebs Cycle.

Step 3 – The final sequence of respiration reactions occurs in the ETC (Figure 4). The ETC is a membrane-bound system through which electrons flow down a redox gradient. As noted above, O2 is the terminal electron acceptor for aerobic respiration and other inorganic molecules can function as terminal electron acceptors for non-fermenting anaerobic bacteria. Sulfate reducing bacteria (SRB) use SO4=, nitrate reducers use NO3, and other, specific metabolic groups use the other anions listed above. Note that organisms assigned to a group based on their terminal electron acceptor can be genetically diverse.


Fig 4. Electron Transport Chain – ETC.

Aerobic and anaerobic respiration generate a net of 30 to 32 ATP molecules per molecule of glucose. In contrast, fermentation yields only two ATP molecules per molecule of glucose.

Fermentation Pathways

Figure 5 shows two fermentation pathways – homolactic and heterolactic. Homolactic fermentation produces two molecules of lactate per glucose molecule, Heterolactic fermentation produces one lactate and one ethanol molecule (note – 6 carbon atoms in and 6 carbon atoms out). As shown in Figure 6, alcohol fermentation produces two ethanol and two CO2 molecules (again 1 C6 sugar &rarr 2 C2 alcohol + 2 CO2 molecules – six carbon atoms in and six caron atoms out).


Fig 5. Homolactic and heterolactic acid fermentation pathways.


Fig 6. Ethanol and acetic acid fermentation pathways.

From an energy generation perspective, fermentation generates only 2 ATP per glucose molecule. Thus, respiration produces energy (i.e., ATP) much more effectively than fermentation does.

Summary

As with the other characteristics common to all living organisms, energy generation is universal. The two primary energy production processes used are respiration and fermentation. Anerobic or anaerobic respiration produces 32 to 38 ATP molecules per glucose molecule catabolized. Fermentation produces only two. The figures I’ve presented in this overview are simplified versions of the actual pathways. I invite those who are interested in a more detailed explanation of any of these metabolic pathways to search the internet or pick up a biochemistry textbook.

As always, please share your comments and questions with me at fredp@biodeterioration-control.com.

MICROBIOLOGY FOR THE UNITINTIATED – PART 4: MICROBIAL REPRODUCTION


Tree of life

All Organisms Share Common Characteristics

As I explained in April’s column, all life forms share at least six common properties (variations of this list that include additional properties):

  • Order
  • Growth
  • Homeostasis
  • Metabolism
  • Reproduction
  • Respiration

In April I focused on order and growth. I followed with a discussion of homeostasis and metabolism in May. In this month’s article I will focus on reproduction.

Reproduction

The online Mirriam-Webster dictionary defines reproduction as “the process by which plants and animals give rise to offspring and which fundamentally consists of the segregation of a portion of the parental body by a sexual or an asexual process and its subsequent growth and differentiation into a new individual.” Were it not for reproduction, the first generation of a given type of microbe (or any other organism) would never be followed by a second generation.

In previous posts, I’ve distinguished between growth (increasing mass) and proliferation (increasing cell numbers). However, in microbiology, it is common to refer to proliferation as population growth (or simply growth). The time required for the number of cells to double is called the generation time (G). As I discussed in my August 2021 What’s New article. In that article, I made the point that bacterial colonies typically become visible once they contain approximately 1 billion cells and that it takes 30 generations for one cell to proliferate into 1 billion cells (Figure 1; 230 = 1.0 x 10⁹ – 1 billion). Figure 2 illustrates the slopes and 9.0 Log10 cells mL-1 endpoints for microbes that have generation times ranging from 0.5 h to 4 h. Reiterating the take home lesson from August 2021, if you are depending on culture test data, continue to record colony counts until they no longer change after an additional 48 h observation period. It is not uncommon for ecologically important microbes to have generation times that are 10 h or longer. Such microbes will require a week or longer to form visible colonies.


Fig 1. Bacterial proliferation – bacteria reproduce by binary fission. The time required for cells to divide is the Generation time (G). Once approximately 1 billion cells accumulate (30 generations) their aggregated mass is visible as a colony.


Fig 2. Exponential growth – impact of generation time (G) on time lapsed before a single cell multiplies through 30 generations. Bacteria with 30 min generation times can produce visible colonies within 15 h. As G increases, so does the delay between inoculation and colony visibility.

Bacteria – Bacteria reproduce by binary fission (Figure 3). As binary fission begins, the cell’s chromosome becomes visible when observed through a microscope (Figure 3a). Next, the cell wall and plasma membrane grow, and the chromosome begins to replicate itself (Figure 3b). Once the chromosome has duplicated itself and the two daughter chromosomes separate, a septum begins to form between the two cells (Figure 3c). The two daughter cells typically separate once the septation process is complete (Figure 3d). However, with some types of bacteria the cells do not separate. These microbes form chains or filaments (Figure 4).


Fig 3. Binary fission – a) chromosome condenses; b) chromosome replicates as cell wall and plasma membrane grow; c) newly formed replicate chromosomes separate while cell wall and plasma membrane begin to form a septum; d) once septum has formed, daughter cells separate. Adapted from Bacterial reproduction medical images for power point (slideshare.net).


Fig 4. Bacterial chains and filaments – a) Bacillus megaterium (rod-shaped bacterium) chain (source: https://www.flickr.com/photos/occbio/6414377511/); b) Streptococcus sp. (spherical – coccoidal – bacterium) chain (source: https://www.wikidoc.org/index.php/Streptococcus); Beggiatoa sp. sheathed filament (source: https://alchetron.com/Beggiatoa).

Fungi – Fungi reproduce either sexually or asexually. As discussed for bacteria, during asexual reproduction a cell replicates its entire complement of genes so that daughter cells each receive their genes from a single parent. In contrast, during sexual reproduction, the parents’ cell’s chromosomes separate (see below) with half of the genes going into each of two gametes. For some fungal species, gametes from different hyphae can combine. For others, gametes must come from two different colonies.

Unlike bacteria and archaea, fungi are eukaryotes – their internal structures, including the nucleus, are membrane bound. Consequently, fungal reproduction begins with either mitosis or myosis. After mitosis, the cell’s DNA is duplicated to that each daughter cell’s nucleus has a complete copy of the parent cell’s DNA. In this regard, mitosis is similar to bacterial binary fission.

There are three asexual fungal reproduction mechanisms:

  • Budding – as illustrated in Figure 5, yeast cells most commonly reproduce by budding. The process begins as a yeast cell produces a bud. As the bud continues to emerge, the nucleus migrates towards the bud as DNA replicates by mitosis. The original (parent) nucleus divides and the two daughter nuclei migrate apart as one nucleus enters the bud and the other returns to the nucleus’ original location within the parent cell. As the bud matures, the cell membrane and wall develops until there are two separate cells. This process is called cytokinesis. The daughter cells can separate or remain attached to one another. If the latter occurs, the yeast cells can form chains or clusters.
  • Fragmentation – cells in fugal filaments (hyphae) divide by mitosis. As shown in Figure 6, hyphae can elongate, form branches, or both as cells divide.
  • Sporulation – filamentous fungi form specialized hyphae called aerial hyphae. Spores then form at or near the top of these areal hyphae (Figure 7). Spores formed by fungi such as Hormoconus resinae or Penicillium sp. that commonly grow in fuels or metalworking fluids are called conidia. These spores are pigmented and give fungal colonies their characteristic colors (Figure 8).


Fig 5. Yeast reproduction by budding – parent cell forms bud, cell’s nucleus begins DNA replication, once daughter DNA has been produced, the nucleus divides and the two nuclei migrate to the bud and parent cell respectively, the cell ultimately divides into two daughter cells which then continue to grow to maturity, after which each daughter cell will form one or more buds.


Fig 6. Filamentous fungus with fragmenting hyphae – note that as cells within filaments divide, filaments can elongate, branch, or both. Source: https://images.fineartamerica.com/images-medium-large-5/fungal-hyphae-dennis-kunkel-microscopyscience-photo-library.jpg


Fig 7. Penicillium colony with close up images of aerial hyphae and conidia.


Fig 8. Fungal colonies on growth medium. Different colors reflect characteristic pigmentation of each species’ spores. Source hold-breath-fungus-goes-airborne-easier-than-we-thought.w1456.jpg (1456×1092) (wonderhowto.com)

To reproduce sexually, gametes are formed in special hyphae. As I noted above, each gamete is haploid (i.e., contains a single set of chromosomes). Depending on the species, either two of these specialized hyphae from a single mycelium fuse or hyphae from two different mycelial masses (colonies) fuse. A pair of gametes then fuses to form a cell that contains two haploid nuclei. The two nuclei then fuse to form a diploid (i.e., paired chromosomes) zygote. Each zygote then divides to produce ascospores. When these ascospores disperse and settle onto suitable surfaces, they germinate and form new mycelia (Figure 9). This is a superficial explanation of fungal sexual reproduction. The details vary substantially among fungal species. The key point to remember is that sexual reproduction is the primary means by which genetic diversity occurs among fungi of a given species.


Fig 9. Fungal (Ascomycete) sexual reproduction cycle – specialized mycelial cells fuse to form a heterokaryotic cell – unmerged, haploid chromosomes from two gametes. The two chromosomes then merge to form a zygote. Zygote divides to produce spores. Spores germinate to initiate new mycelia.

Gene Transfer Beyond Reproduction

I often talk about promiscuity among microbes. This reflects the ease with which microorganisms transfer genetic material among cells within a microbiome. There are three primary mechanisms by which horizontal gene transfer occurs:

  • Transformation
  • Transduction
  • Transfection

Transformation – a DNA fragment from a dead or damaged cell is released into the environment, enters another cell, and replaces a fragment of the receiving cell’s DNA. Typically, DNA fragments contain approximately 10 genes. Figure 10 illustrates the transformation process.

Transduction – a bacteriophage (type of virus that infects bacteria) transfers DNA from one cell to another. The process is illustrated in Figure 11.

Conjugation – genetic recombination occurs when two cells attach to one another (in Gram negative bacteria, a sex pilus (tubular cell structure) links the cells and a DNA fragment (plasmid) transfers from one cell to the other. The plasmid can remain as extra chromosomal (i.e., not integrated into the recipient’s chromosome) DNA or be integrated into the recipient’s chromosome. One common plasmid that is transferred via conjugation carries genes responsible for microbicide (or antibiotic) resistance. Figure 12 illustrates conjugation.


Fig 10. Transformation: Step 1: A donor bacterium dies and is degraded. Step 2: DNA fragments, typically around 10 genes long, from the dead donor bacterium bind to transformasomes on the cell wall of a competent, living recipient bacterium. Step 3: In this example, a nuclease degrades one strand of the donor fragment and the remaining DNA strand enters the recipient. Competence-specific single-stranded DNA-binding proteins bind to the donor DNA strand to prevent it from being degraded in the cytoplasm. Step 4: RecA proteins promotes genetic exchange between a fragment of the donor’s DNA and the recipient’s DNA for the functions of RecA proteins). This involves breakage and reunion of paired DNA segments. Step 5: Transformation is complete. Source: Horizontal Gene Transfer in Bacteria


Fig 11. Transfection – a) A bacteriophage adsorbs to a susceptible bacterium; b) The bacteriophage genome enters the bacterium. The genome directs the bacterium’s metabolic machinery to manufacture bacteriophage components and enzymes. Bacteriophage-coded enzymes will also breakup the bacterial chromosome; c) Occasionally, a bacteriophage capsid mistakenly assembles around either a fragment of the donor bacterium’s chromosome or around a plasmid instead of around a phage genome.; d) The bacteriophages are released as the bacterium is lysed. Note that one bacteriophage is carrying a fragment of the donor bacterium’s DNA rather than a bacteriophage genome; e) The bacteriophage carrying the donor bacterium’s DNA adsorbs to a recipient bacterium; f) The bacteriophage inserts the donor bacterium’s DNA it is carrying into the recipient bacterium; g) Homologous recombination occurs and the donor bacterium’s DNA is exchanged for some of the recipient’s DNA; h) Specialized Transduction by Temperate Bacteriophage. Source: Horizontal Gene Transfer in Bacteria


Fig 12. Conjugation – Mobilizable plasmids, that lack the tra genes for self-transmissibility but possess the oriT sequences for initiation of DNA transfer, can also be transferred by conjugation if the bacterium containing them also possesses a conjugative plasmid. The tra genes of the conjugative plasmid enable a mating pair to form while the oriT sequences of the mobilizable plasmid enable the DNA to move through the conjugative bridge. Source: Horizontal Gene Transfer in Bacteria

Summary

Reproduction is the means by which all organisms proliferate. Without reproduction, even a theoretically immortal cell would not have much impact on the environment in which it lives. The time required for a population to double is called the generation time. Colonies in or on solid nutrient media become visible after approximately 30 generations (one cell proliferates to approximately one billion – 109 – cells). Broth media typically becomes turbid when the population density is approximately one million (106 cells mL-1). This takes 20 generations (220 = 1.0 x 10⁶). Bacteria reproduce asexually. Fungi can reproduce either asexually or sexually. An organism’s characteristics evolve when a successful mutation occurs, when DNA fragments are transferred among cells, or via sexual reproduction. But this is a topic for a future article.

For more information, contact me at fredp@biodeterioration-control.com.

MICROBIOLOGY FOR THE UNITINTIATED – PART 3: WHAT IS LIFE – CONTINUED


Tree of life

All Organisms Share Common Characteristics

As I explained in last month’s column, all life forms share at least six common properties (variations of this list that include additional properties):

  • Order
  • Growth
  • Homeostasis
  • Metabolism
  • Reproduction
  • Respiration

In April I focused on order and growth. This article will focus on homeostasis and metabolism.

Homeostasis

To survive, cells must be able to regulate their internal environment. Collectively, the numerous processes by which cells maintain a stable internal environment are called homeostasis. For example, cells function optimally when the sodium (Na+) and potassium (K+) concentrations are in balance and at the right levels. Similarly, although some microbes can thrive in environments with pH <2 and others can thrive in environments with pH >12, most microbes maintain an internal pH of approximately 7.2 ± 0.2. Although there are exceptions, conditions inside cells differ from those of their environment. Cell membranes control the movement of solvents (i.e., water) and solutes (dissolved molecules such as Na+, K+, organic molecules used as food, etc.). The membranes function as semipermeable barriers but also contain various molecular structures that actively control the movement of molecules across the barrier. The key point for homeostasis is that, as illustrated in Figure 1, the composition of a cell’s cytoplasm is substantially different from that of its environment.


Fig 1. Homeostasis illustrated – solute concentrations inside the cell (e.g., [Na+]I) are maintained at levels needed for healthy metabolism regardless of their concentrations in the external environment (e.g., [Na+]o). Osmol is osmolarity – the total number of moles of solute per L in a solvent (dissolved organic chemicals + cations + anions).

Metabolism

Metabolism includes all the biochemical reactions by which cells obtain energy and convert nutrients into new cell mass, waste products, and heat. Catabolism includes the biochemical reactions that convert large, food molecules (e.g., carbohydrates, proteins, and lipids) into their individual building blocks (e.g., sugars, amino acids, and fatty acids) as illustrated in Figure 2. Anabolism includes the biochemical reactions that assemble building block molecules into new cell components (i.e., carbohydrates, proteins, nucleic acids, lipids, etc.) as shown in Figure 3. Catabolic metabolic pathways typically capture energy and anabolic pathways consume energy. Both types of metabolism generate heat that is lost to the environment in which microbes are growing. Commonly, microbes are classified on how they obtain energy and how they use carbon-based molecules for anabolism.


Fig 2. Catabolism – macromolecules are broken down into their building blocks. In this figure, proteins are catabolized to amino acids (top) and carbohydrates are catabolized to individual sugar molecules (bottom).


Fig 3. Anabolism – building block molecules such as amino acids (top) and sugars (bottom) are assembled into macromolecules.

Energy metabolism

Phototrophic microorganisms – bacteria and algae – obtain their energy from sunlight. Phototrophic microbes are only likely to cause biodeterioration problems in systems exposed to sunlight.

All other microorganisms are chemotrophs – they conserve energy from chemicals. If the microbe conserves energy by obtaining electrons from inorganic molecules such as ammonium (NH4), hydrogen (H2), iron (Fe2+), nitrite (NO2), phosphite (HPO3), sulfide (HS), sulfur (S0), among others, it is a lithotroph. If the microbe conserves energy from organic molecules it is a fermenter.

Carbon metabolism

Autotrophic microorganisms use inorganic carbon – i.e., either carbon dioxide (CO2), carbon monoxide (CO), or methane (CH4) – to build organic molecules. Strictly speaking CH4 is a C1 organic compound. However, in the world of microbiology, all three C1 compounds listed here are considered to be inorganic. Thus, photoautotrophs conserve energy from light and use inorganic carbon (CO2). Chemoautotrophs conserve energy from inorganic compounds and use inorganic carbon (CO2, CO, or CH4). Chemoautotrophs are also called chemolithoautotrophs.

Heterotrophic microorganisms use organic molecules (molecules built from carbon and hydrogen, either with or without other atoms such as nitrogen – N, oxygen – O, phosphorus – P, or sulfur – S) as their carbon sources. As noted in the previous paragraph, in the context of microbial metabolism, compounds with two or more carbon atoms are organic. Just like autotrophs, heterotrophs are divided in to two groups, based on their energy source. Photoheterotrophs obtain their energy from light and chemoheterotrophs obtain their energy from organic compounds.

Nutritional requirements vary tremendously among microbes that obtain carbon from organic compounds. Some microbes can only use C2 or C3 molecules such as acetate. Others can attack complex, high molecular weight molecules (macromolecules). Some microbes are fastidious – their diets are severely limited. Others can utilize a variety of organics.

Table 1 summarizes the types of energy and carbon utilization modes used by microorganisms. The possible combinations of energy sources x terminal electron acceptors x carbon sources provide the basis for the microbial world’s tremendous diversity. No single type of microbe has all of the different tools for obtaining energy or food. However, as I explained in May 2022’s What’s New article, microbes most commonly live within biofilm communities.

Table 1. How microorganisms conserve energy and obtain carbon.


Consortia

Acting in community – consortia – the metabolic capabilities of individual types of microbes create a net capability that far exceeds that of a single type. This is a critical point to understand. Throughout much of the history of environmental microbiology – particularly diagnosis of biodeterioration damage to industrial systems – investigators typically relied on culture test methods to recover and identify the microbes present. Investigators would then attempt to reproduce the biodeterioration process in jars that contained the process fluid (cooling tower water, fuel over water, water-miscible metalworking fluids, etc.). Invariably, it was rarely possible to reproduce the biodeterioration phenomenon. Stakeholders would then speculate that the damage had been caused by “superbugs.” Only after investigators started to use fluids and materials from the systems in which damage was observed did they begin to recognize the power of consortia. The loose analogy here is the difference between one individual and team of tradespeople – carpenters, electricians, plumbers, building a house. It’s the rare individual that can build a modern house. Even a person with all of the required skills will need months or years to complete the work that a crew can finish in a few weeks. Similarly, in industrial systems, biodeterioration damage is caused by different types of microbes – each which a limited number of capabilities working in synergy with the others.

One common dynamic in consortia is the successive degradation of high molecular weight molecules. Consider Figure 4. Some microbes are able to attack fuel molecules. In a closed system, the waste products (metabolites) produced by these microbes accumulates to toxic concentrations Figures 4a. The traditional bacterial growth curve (Figure 4b) reflects the combined effects of nutrient consumption and metabolite toxicity. In consortia, microbes that are unable to eat large molecules eat the metabolites of those that can (Figure 4 c). Additionally, within biofilm environments, aerobic and facultatively anaerobic microbes consume oxygen to create anoxic zones in which obligate anaerobes can thrive (Figure 4d).


Fig 4. Microbial consortia – a) Microbe A eats C17-hydrocarbons but as metabolites accumulate they become toxic to the microbe; b) traditional closed system growth curve – initially, microbes acclimate to the environment (lag phase); once acclimated the population doubles logarithmically as a function of time (log phase); eventually, as metabolites accumulate, cells die at the same rate new cells are created (stationary phase); ultimately, the die-off rate exceeds the growth rate (death phase); c) Microbe A eats C17-hydrocarbons and Microbe B eats the metabolites – preventing them from accumulating in the closed system; d) oxygen concentration gradient ([O2]) through a biofilm – aerobes at the biofilm-bulk fluid interface (yellow-green) consume oxygen to create an anoxic (red) environment in which anaerobes can thrive.

Summary

Physical and chemical conditions inside microbial cells differ from those of the surrounding environment. Consequently, cells expend substantial energy maintaining constant internal conditions. Collectively, all of the metabolic processes that contribute to maintaining stable internal conditions are called hormonesis. Metabolic processes are either catabolic – when larger molecules are broken down into smaller molecules that are then used as building blocks – or anabolic – the means by which building block molecules are converted into cell components. Additionally, metabolic activity can be divided into energy and carbon metabolism. Energy metabolism involves the use of an energy source and terminal electron donor. Although some microbes can use single carbon (C1) molecules, the vast majority of microbe types that have been identified to date obtain their carbon from organic molecules. Microbes working in consortia do things that no single microbe can.

If you have any questions about this article or microbial contamination-related issues, please contact me at fredp@biodeterioration-control.com.

MICROBIOLOGY FOR THE UNITINTIATED – PART 2: WHAT IS LIFE?


Tree of life

All Organisms Share Common Characteristics

In last month’s column, I wrote about what microbes are, where they are found, and why everyone should have some understanding of the microbial world. In this article, I will provide a superficial overview of how microbes live. I’ll start with a summary of the common characteristics of all living things. As illustrated in Figure 1, all life forms share at least six common properties (variations of this list that include additional properties):

  • Order
  • Growth
  • Homeostasis
  • Metabolism
  • Reproduction
  • Respiration

I’ll spend this and the next two articles discussing each of these properties. This article will focus on order and growth.

Order

All organisms are ordered. Each cell is bound by a membrane, wall, or both. The fluid (cytoplasm) within each cell contains the ingredients the cell needs to function. Bacteria and Archaea (prokaryotes) have no visible, membrane-bound internal structures. All protozoan, plant, animal, and fungal cells have membrane-bound, internal organelles and are classified as eukaryotes. Figure 2 compares prokaryotic (Figure 2a) and eukaryotic (Figure 2b) cell structures.


Fig 1. Common properties of all living things.


Fig 2. Typical cell structures – a) prokaryote (bacterial cell); b) eukaryote (yeast cell).

Growth

Growth is an organism’s increase in size, mass, or both. Often growth is conflated with proliferation. As I’ll discuss in a future article, proliferation is the increase in cell numbers as a result of reproduction. Thus, growth and proliferation (reproduction) are two different properties. Figure 3 illustrates growth. The size of the cell increases to a specific size, after which it begins to divide.


Fig 3. Cell growth – a) cell’s initial size; b) cell’s size as it begins to divide.

Summary

All living things – organisms – share a set of properties. The list of common properties varies among authors, but the list I provided at the beginning of this article is uncontroversial. The first two universal properties that define living beings are order and growth.

Order means that there is a consistent structure. Bacteria and archaea are protists – they have cell membranes and walls but no membrane-bound internal structures. Algae, fungi, and protozoans (like all plant and animal cells) are eukaryotes – their cells all have membrane-bound internal structures. I’ll return to these properties in a future article.

Growth means that the organism’s mass increases – cells become larger – to a certain point – as they mature. I’ll explain the difference between growth and reproduction in my June What’s New article.

Some have argued that viruses meet these two criteria. They are indeed ordered – i.e., have genetic and structural components – but individual virions do not grow.

If you have any questions about this article or microbial contamination-related issues, please contact me at fredp@biodeterioration-control.com.

OUR SERVICES

  • Consulting Services
  • Condition Monitoring
  • Microbial Audits
  • Training and Education
  • Biocide Market Opportunity Analysis
  • Antimicrobial Pesticide Selection

REQUEST INFORMATION


    captcha