In my August post (https://biodeterioration-control.com/microbial-damage-fuel-systems-hard-detect-part-14-test-methods-still-microbiological-tests/), I discussed using ASTM D7687 to quantify microbial loads (AKA bioburdens) in liquid samples – fuels and fuel associated water. This post will focus on surface samples.
Generally speaking, microbes tend to be most abundant on surfaces. By some estimates, in any given system, for every microbe floating in the bulk fluid, there are 1,000 to 1,000,000 growing on surfaces. These surface microbes are invariably part of biofilm communities. I’ll discuss biofilms in more detail in a future post. For now, it is sufficient to understand that biofilms are slime-encased microbial communities growing on surfaces (fig 1). It is much easier to grab a fluid sample than a surface sample. Consequently, most fuel system samples – even those intended for microbiology testing – are fluids. However, there are a few fuel system surfaces that can be sampled relatively easily.

Fig 1. Scanning electron micrograph of a mature biofilm. Note its structural complexity. Source http://drandreastevens.com/wp-content/uploads/2016/02/Biofilm-Photo.png
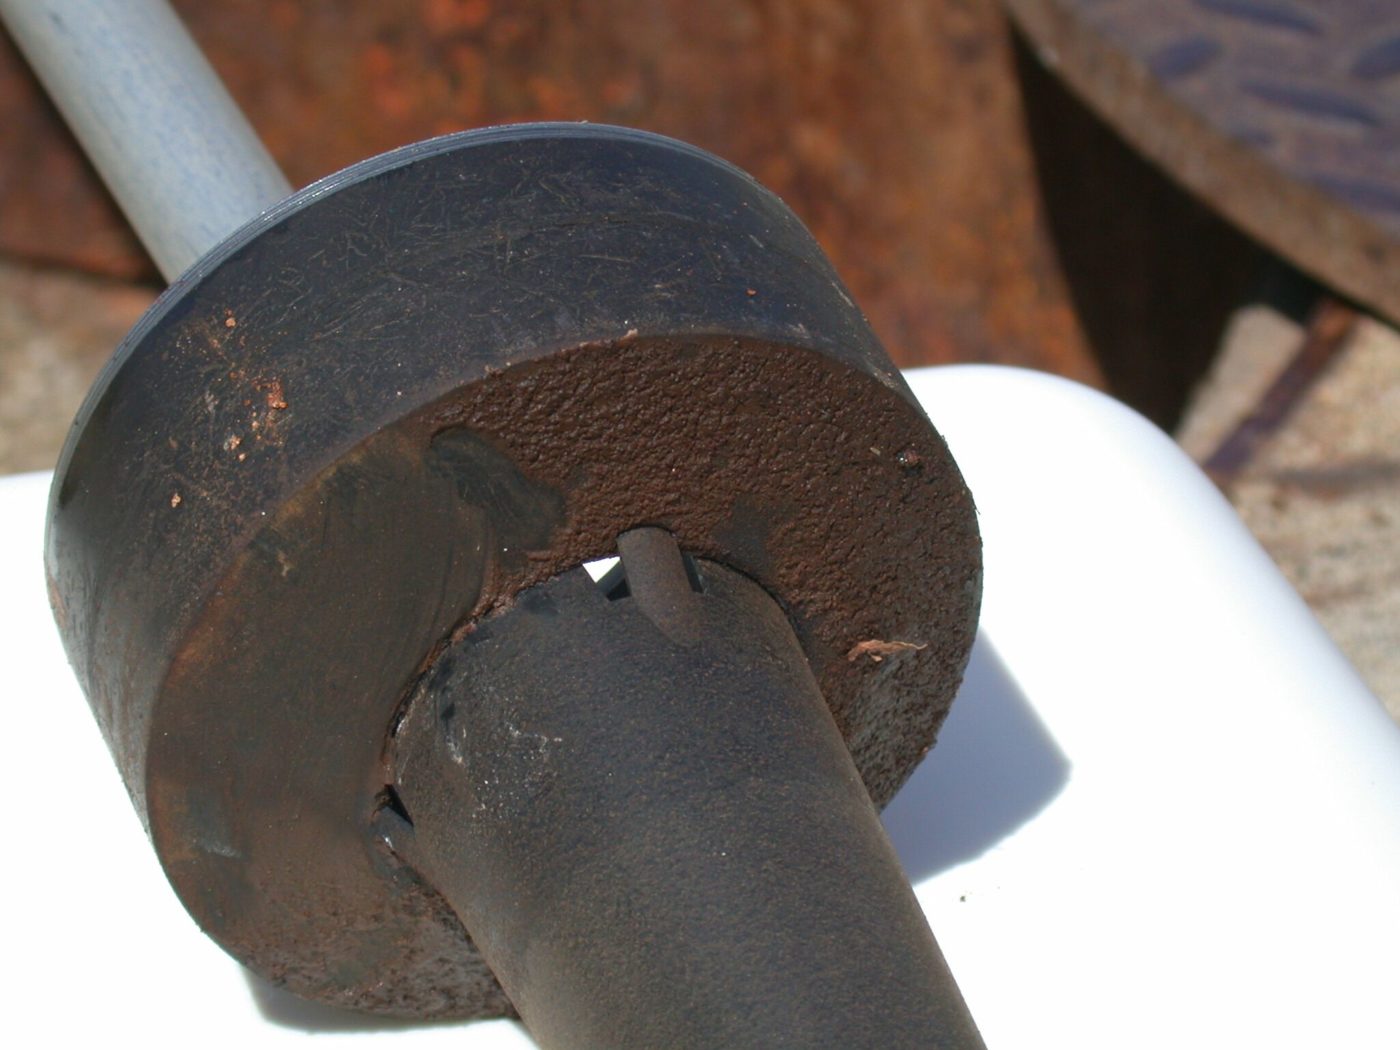
Fig 2. Automatic tank gauge, water float showing slime accumulation (right) and swabbed area (left).
Biofilms tend to develop on automatic tank gauge (ATG) water floats (fig 2). The left side of the water float shown in figure 2 has been swabbed. The right side shows the undisturbed deposit. This deposit includes microbes, their slime, and metal fins (i.e. rust). Most often, I use a swab to collect a sample from a premeasured surface area. If the deposit is > 2 mm (1/8 in) thick, I use a spatula to collect the sample.
The second location I routinely check for microbial contamination is the filter. Figure 3a shows a 76 cm (30 in) filter cartridge. It was one of 16 cartridges in a high-capacity filter housing. However, except for its length, the 76 cm cartridge does not look very different from the filter element inside a typical fuel dispenser filter (fig 3b). To test the filter element for microbial contamination, I first inspect the element visually; looking for slime accumulations or discolored zones. For larger filters, I use an alcohol-disinfected forceps and scissors to cut out a section ( 4 cm x 4 cm; fig 3c), and from that cut out a 1 cm x 2 cm piece of filter medium (fig 3d). For dispenser filters, I cut out a 1 cm x 2 cm piece directly. This is my specimen.
If a dispenser has a screen (fig 4), upstream of the filter I collect either a swab or spatula sample just as I would from the ATG water float.
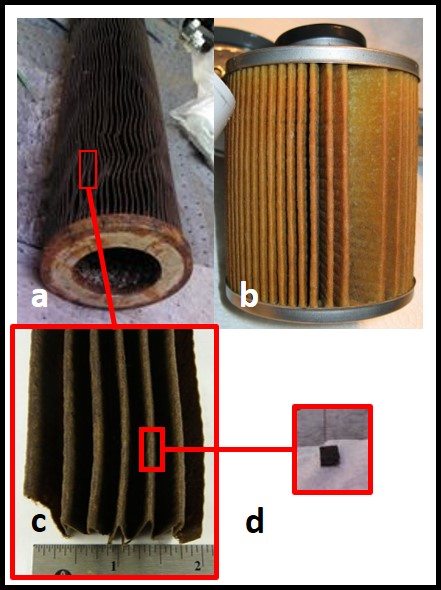
Fig 3. Fuel filter sampling: a) 60 cm filter element from high-capacity housing; b) dispenser filter element; c) section of filter media taken from element shown in fig 3a; d) 1 cm x 2 cm specimen taken from section shown in fig 3c.
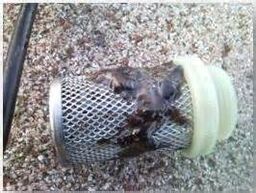
Fig 4. Fuel dispenser prefilter screen partially covered with slime.
Once I’ve collected my surface sample I run LuminUltra Technologies, Ltd, Deposit and Surface Analysis (DSA) test (for more information about the DSA method visit https://www.luminultra.com/dsa/; for a video demonstration, visit https://www.youtube.com/watch?v=VEhpbvtej3E). The method provides me with a rapid, quantitative measure of the bioburden on these fuel system surfaces.
Total ATP concentration ([tATP]) <100 pg/cm2 indicates negligible surface contamination. [tATP] between 100 pg/cm2 and 1,000 pg/cm2 indicates moderate contamination (it’s time for maintenance action). [tATP] ≥ 1,000 pg/cm2 signals that prompt corrective action is needed! If you have weighed out samples, the [tATP] per g threshold levels are the same as those for [tATP] per cm2.
If you’d like to learn more about fuel system surface microbiology, please contact me at fredp@biodeterioration-control.com.
