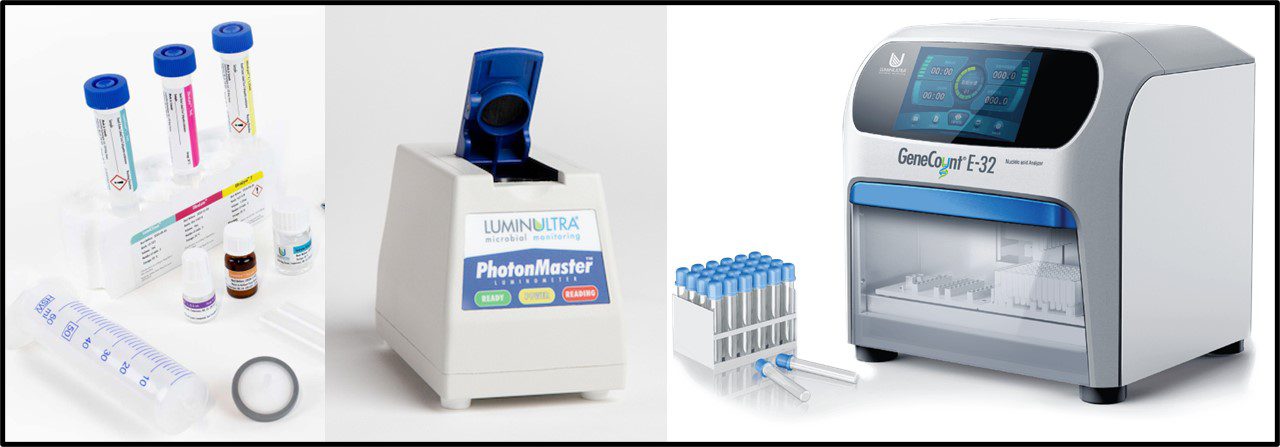
Left: ATP Test kit supplies; Center: PhotonMaster luminometer for ATP luminometry; Right: GeneCount E-32 apparatus for qPCR (Images courtesy of LuminUltra Technologies, Ltd., Fredericton, NB, Canada).
New Publication
The relationship between microbial population ATP and quantitative PCR bioburdens in diesel fuel microcosms (Access Microbiology 2024;6:000695.v4) was published last month. I’ll start this post by thanking my co-authors Dr. Jordan Schmidt and Ms. Danika Nicoletti, both of LuminUltra Technologies Ltd, Fredericton, NB, Canada) for their collaboration and the Coordinated Research Council (CRC) for funding the study from which we obtained our samples.
Measuring Bioburden
In my July 2017 post (Fuel System Microbiology Part 12 – Test Methods – Microbiological Tests), I provided an overview of the primary groups of test methods available for measuring microbiological contamination levels (bioburdens) in fuels and other industrial process fluids. I continued the overview in Fuel System Microbiology Part 13 – Test Methods – More on Microbiological Tests. In his book, “The Structure of Scientific Revolutions,” historian and science philosopher Thomas S. Kuhn (1922 to 1996) opined: “The answers you get depend on the questions you ask.” I wrote about this in my second July 2017 post. No test method is universally better than other available methods. Each approach has advantages and limitations relative to the alternative methods, depending on the information one is attempting to obtain.
For diagnostic testing, my preference is to use several different methods. Traditionally, I have used chemical microbiology methods such as catalase activity or – since 2009 – cellular adenosine triphosphate concentration ([cATP]) and various culture tests. More recently, I’ve begun to augment these tests with quantitative polymerase chain reaction (qPCR) testing. Chemical tests such as [cATP] by ASTM Test Method D7687 assess metabolically active bioburdens. Although the actual [cATP] per microorganism varies considerably due to each microbe’s genetics and physiology, hundreds of studies performed since 1954, have consistently reported that in environmental samples, [cATP] = 1 pg mL-1 ≈ 1,000 cells mL-1 (1 pg = 10-12 g). However, ATP testing only detects metabolically active microorganisms. Moreover, it does not identify the types of microorganisms present in the sample. Traditionally, culture testing (for example ASTM Practice D6974 and Test Method D7978) provided the only means of identifying the types of microbes present. Microbes that reproduced in or on nutrient media could be isolated and tested further for taxonomic identification. Moreover, microbes that were dormant in environmental samples, could recover and form colonies on nutrient media. This latter capability could be viewed as an advantage for detecting inactive microorganisms that could potentially cause problems if they became metabolically active. It could also be viewed as a disadvantage because dormant microbes that generated positive culture test results might not actually be causing problems. The risk was time and expense responding to non-existent problems.
Culture testing remains the only practical tool for obtaining pure cultures on which to perform certain types of studies. However, genomic testing has become an increasingly valuable tool for quantifying specific types of microbe present in samples. ASTM Guide D8412 provides an overview of qPCR testing. I’ll provide more details below. Here, I’ll simply indicate that qPCR can be used to assess broad groups of microbes (e.g., total prokaryotes – bacteria and archaea, or total eukaryotes – fungi, protozoa, etc.) or individual taxa (I suspect that few readers have not been tested for the SARS-CoV-2 virus – COVID – by qPCR). As with all genomic tests, qPCR depends on quantitative extraction of deoxyribonucleic acid (DNA) from all of the microorganisms in the specimen. Additionally, qPCR does not distinguish between dormant and metabolically active microorganisms. However, qPCR – now available as a field test – can provide quantitative data within a few hours. Depending on the type of microbe to be detected, culture testing can require two to 30-days or longer before final results are available.
ATP and qPCR Common Steps
Both test methods start off with similar steps. As Illustrated in Figure 1,
- Microbes are concentrated and separated from the sample (i.e., fuel, fuel-associated water, etc.) by filtration.
- For ATP testing, potentially interfering chemicals are washed away. This step is not needed for qPCR.
- For ATP testing, microbial cells are lysed (broken open) to release their contents. For qPCR cells at not lysed until after they have been resuspended from filter.
- Retain stable extract in appropriate buffer.
The resulting extract includes all of the biomolecules that were originally present inside the intact microorganisms.
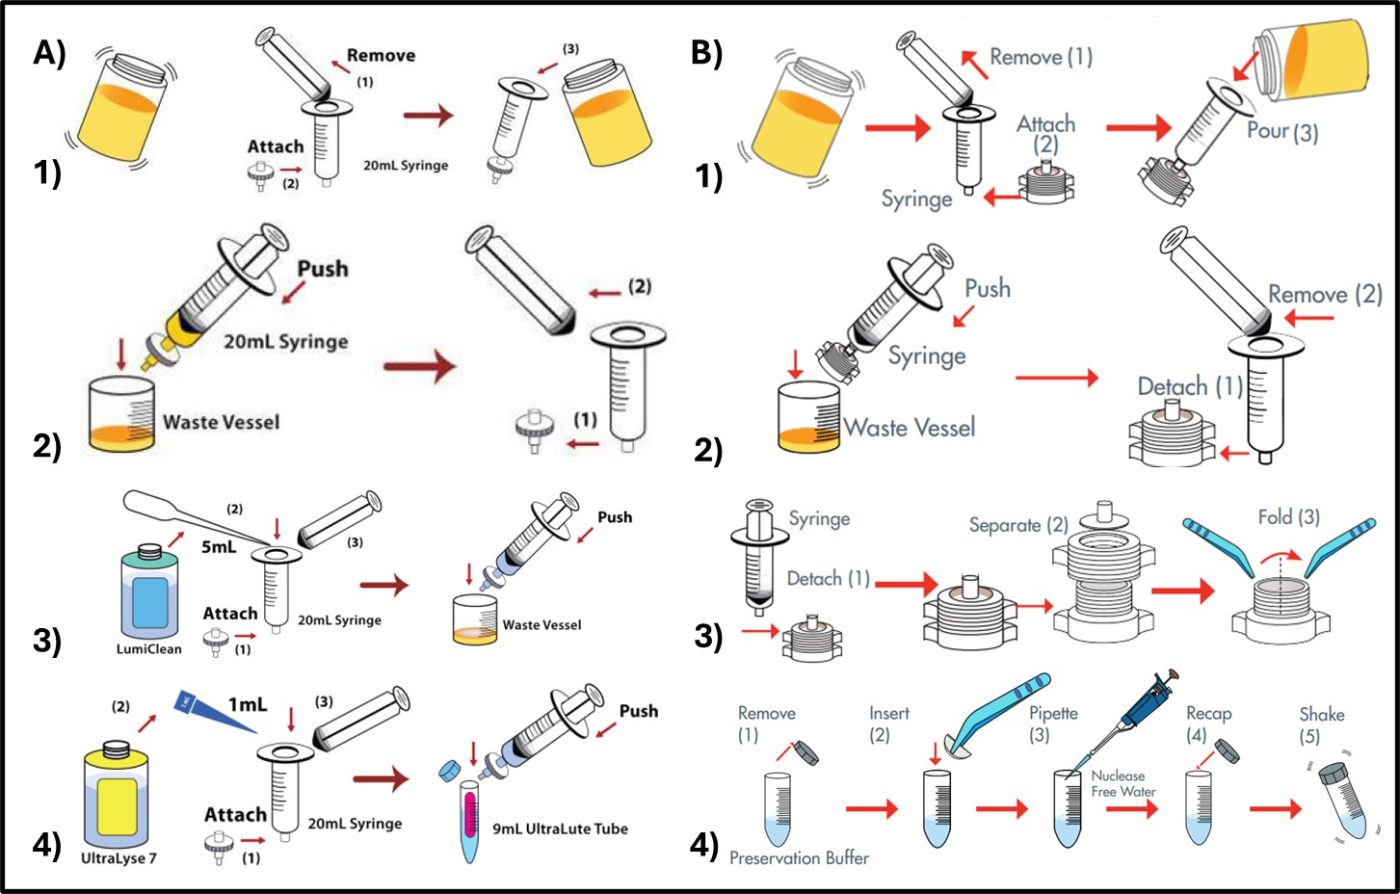
Fig 1. Initial steps for biomolecule testing – A) ATP testing – 1) microorganisms are separated from sample and concentrated by filtering through a glass fiber filter; 2) chemicals that can interfere with assay are washed away; 3) cleaned cells are lysed and their contents are captured in a test tube; 4) extract is preserved in dilution buffer. B) qPCR – 1) and 2) microorganisms are separated from sample and concentrated by filtering through an in-line filter; 3) filter is removed from housing and folded; 4) filter is suspended in preservation buffer.
ATP Test
For ATP testing by ASTM Test Method D7687, the extract is diluted into a reagent that neutralizes any residual wash or extraction reagent that could interfere with the assay. A 100 μL specimen of diluted extract is reacted with 100 μL of Luciferin-Luciferase reagent in a cuvette. The cuvette in placed into a luminometer (device designed to detect the photons of light generated when a molecule of ATP reacts with Luciferin enzyme and Luciferase substrate as summarize in Figure 2). Because every luminometer is unique, the raw results are in relative light units (RLU). The RLU from test specimens are compared against those from a 1 ng mL-1 ATP reference standard to convert RLU to cellular ATP concentration ([cATP]) in pg mL-1.
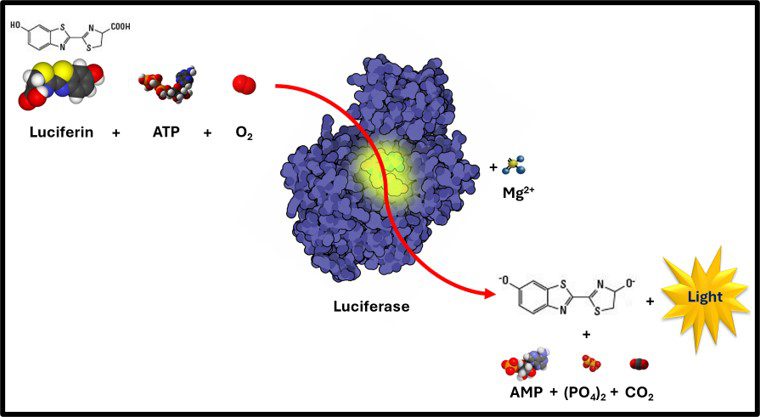
Fig 2. ATP-mediated Luciferin Luciferase reaction- a) Luciferian + ATP + O2 react enzymatically with; b) Luciferase Enzyme and Mg2+ co-factor to produce; c) Oxyluciferin + AMP + (PO4)2 (pyrophosphate) + CO2 + a photon of light.
qPCR Test
For qPCR testing, DNA is extracted from the filter through a sequence of steps that includes cell lysis, and DNA purification. The specimen DNA is resuspended in a buffer (Figure 3) and reagents that include deoxynucleotides (deoxyadenosine triphosphate – dATP, deoxycytidine triphosphate – dCTP, deoxyguanosine triphosphate – dGTP, and deoxythymidine – dTTP), DNA-polymerase, oligonucleotide primers, and a fluorescent dye (Figure3, A, B, C, and D, respectively) are added to a microcentrifuge tube (Figure 3 E) containing the specimen DNA. As shown in the Figure 3 photograph, the cuvette is then placed into an apparatus that runs a series of heating and cooling cycles to alternately denature the specimen DNA (Figure 4a), allow the primers to attached to any matching nucleotide sequences (i.e., genes) on each of the DNA single strands created by the denaturation step (Figure 4b), and allow new double stranded DNA to form (Figure 4c). The amount of DNA that contains the target gene(s) doubles with each thermal cycle (Figure 4d).
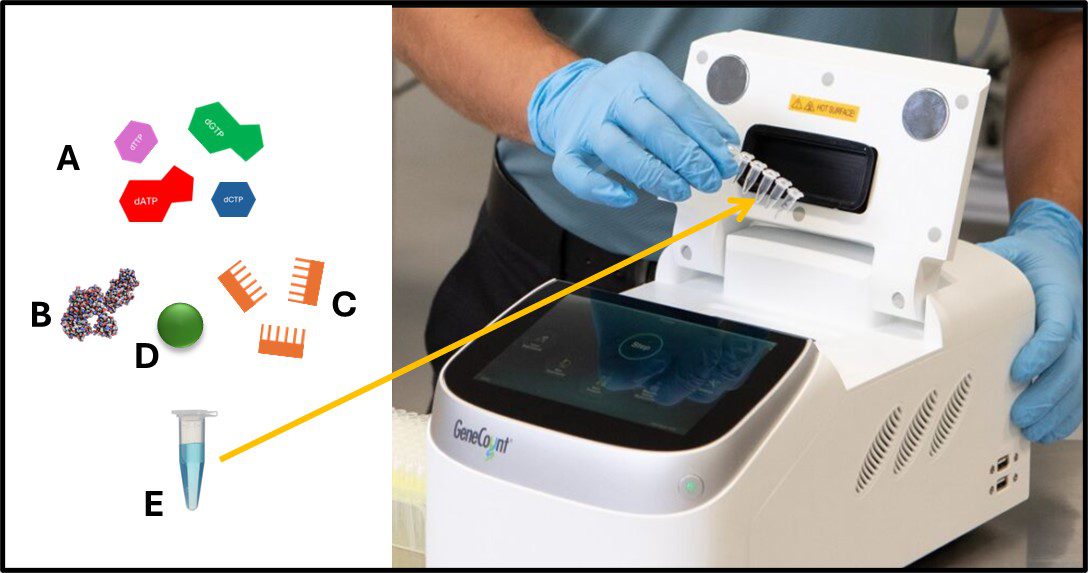
Fig 3. qPCR sample handling – A) deoxynucleotides (dATP, dCTP, dGTP, and dTTP); B) Taq-polymerase; C) 16s RNA primers; D) SYBR Green fluorescent dye; E) DNA specimen in buffer. Photo: Six microcentrifuge tubes being placed into qPCR apparatus.
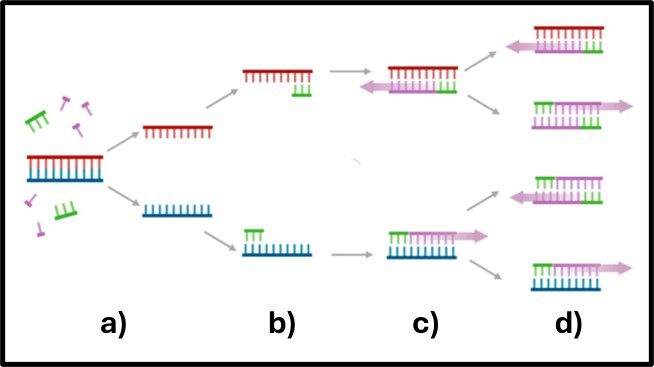
Fig 4. qPCR gene amplification – a) DNA denatured at ~95 °C; b) primers attached to matching genes and DNA anneals at ~68 °C; c) DNA elongates to form new double-stranded DNA; d) after next heating and annealing cycle the number of DNA copies doubles.
The number of thermal cycles needed before the number of gene copies (GC) exceeds a critical threshold (Cq – quantification cycle – the fluorescence at which the signal from the dye linked to DNA is significantly greater than the background fluorescence). Figure 5a illustrates fluorescence curves for known concentrations of a target gene’s DNA. A correlation curve can then be generated by plotting Cq as a function of DNA concentration (GC mL-1) as shown in Figure 5b.
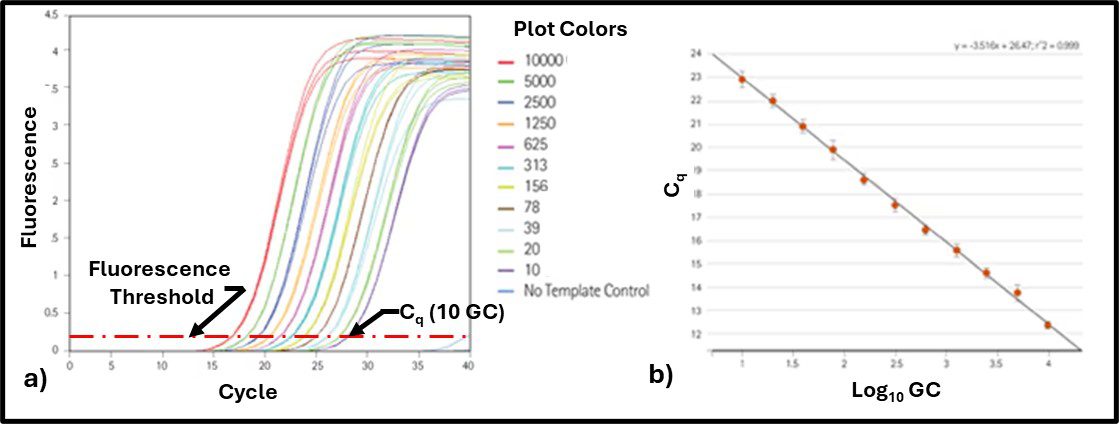
Fig 5. qPCR standard curve – a) fluorescence as function of amplification cycles; b) Cq and a function of the number of gene copies mL-1 (Log10 GC mL-1).
The regression equation for the Figure 5b plot is then used to compute target gene Log10 CG mL-1 in test specimens. For the study reported in our recently published paper the primers were designed to detect either total prokaryotes (TP) or total fungi (TF). Results are reported as gene copies (or amplicon units – AU) rather than as cells because the number of copies each microorganism has of each gene varies among organisms and genes. Thus, for a particular gene, one type of microbe can have more GC than another. Similarly, a given microbe can have more copies of some genes than others. That said, as our investigation demonstrated, there is excellent agreement between ATP and qPCR bioburdens.
Results Comparison
As I discussed above, each microbiology property is affected by different factors. Most commonly, genetics and physiology affect concentrations of biomolecules in microorganisms. Rather than focus on linear correlation, it is more useful to compare attribute score agreement among parameters. For example, consider the relationship between height and weight (Figure 6). Although there is a good, positive correlation between the two parameters, there is substantial spread around the trend line. If one creates height and weight categories (short, medium, and tall; light, medium, and heavy) and compares the respective categorical scores, the height and weight scores agree for 44 % of the 88 individuals tested (Figure 6, green shaded regions; data points close to the trend line). For another 44 %, heights are greater than one would predict from subjects’ weights (Figure 6, purple zones; data points are well below the trend line). Only 12 % of the subjects were heavier than expected based on their height (Figure 6, blue-grey zones).
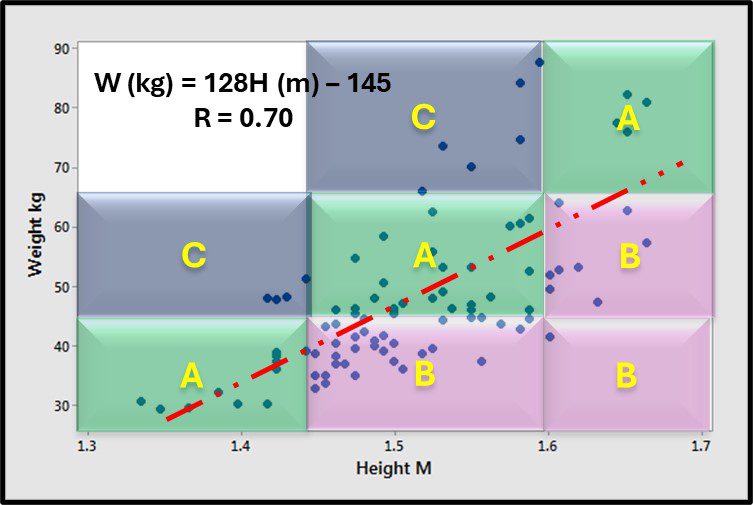
Fig 6. Scatter plot – relationship between height and weight – A) categorical scores for height and weight agree; B) categorical scores for height are greater than those for weight; C) categorical scores for height are less than those for weight.
Similarly, the plots for [cATP] (pg mL-1) versus qPCR (GC mL-1) had considerable scatter but, as shown in Figure 7, their respective categorical scores agreed for 60 % of the samples tested. The ATP-bioburden categorical scores were greater than the qPCR scores for 28 % of the samples and less than the qPCR scores for 12 %. In previous studies, agreement between ATP scores and those obtained by either culture testing or immunoassays were approximately 80 %. This probably reflects the greater variability of GC cell-1 and its impact on qPCR bioburden data.
This study used qPCR primers designed to detect all prokaryotes and all fungi, respectively. However, the growing library of primers now makes it possible to detect microbes with genes directly associated with specific types of biodeterioration (for example, microbiologically influenced corrosion). The test equipment and reagents make it possible to run qPCR in the field, on samples with [cATP] greater than a predetermined upper control limit. Additionally, DNA extracted for qPCR testing can also be used to obtain complete genetic profiles of contaminant populations.
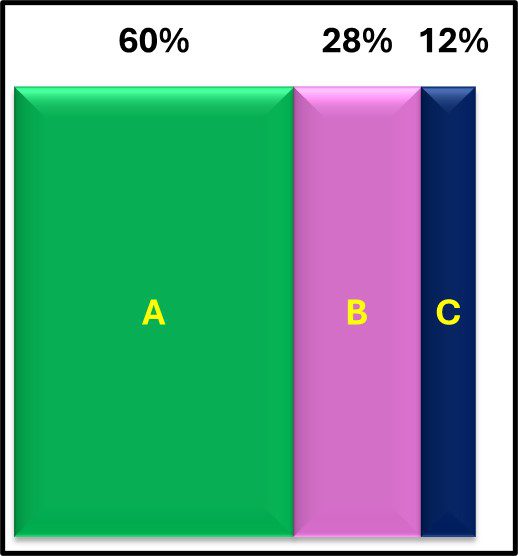
Fig 7. ATP and qPCR categorical score (CS) agreement among 88 samples – A)CSATP = CSqPCR; B) CSATP > CSqPCR; C) CSATP < CSqPCR.
Next Steps
The study reported in June’s Access Microbiology paper was just a beginning. The testing was performed on samples available from a microcosm study. The timing was serendipitous. The good agreement between ATP and qPCR biomass determinations validated the qPCR test method. The next step will be to build a large database of fuel and fuel-associated water test results that include ATP, qPCR, and metagenomic profiles. ATP will provide total metabolically bioburden information. The qPCR data will provide quantitative measurements of various microorganisms of interest. The “of interest” list is likely to change as we get a better understanding of the types of microorganisms present and the relationship between those microbes and biodeterioration.
Summary
I am a proponent of tiered testing. Tier 1 tests are easy to perform while on-site near the point where I collect my samples. They provide reliable data within a few minutes. My primary, Tier 1 microbiology test is ATP (ASTM D4012 for interference-free, water samples, D7687 for fuel and fuel-associated water samples, and E2694 for metalworking fluid and lubricant samples). Although a differential test is available for distinguishing between bacterial and fungal contamination it does not provide gene-targeted test results the way qPCR does. Increasingly, qPCR is my go to Tier 2 test. When the [cATP] is greater than the upper control limit, I have a qualified lab run one or more qPCR tests. I am aware of several oilfield service companies whose field technicians run qPCR tests from the back of their cars. I am also using full genomic profiling to better understand whether specific types of microbes are always present when biodeterioration is occurring. By combining microbiological data with engineering, physical, and chemical data, I hope to be able to recommend more cost effective microbiological contamination control strategies.
I look forward to your thoughts and questions about how industry stakeholders can reverse this shrinking availability of biocidal products. Contact me at fredp@biodeterioration-control.com.
