FUEL & FUEL SYSTEM MICROBIOLOGY PART 22 – PREVENTING MICROBIAL DAMAGE TO FUEL SYSTEMS PART 5; TREATING SYSETMS WITH MICROBICIDES – DOSING
Take two gallons and call me in the morning – not!
In Part 21, I reviewed the three primary types of fuel treatment microbicides – classifying them by their respective solubilities in fuel and water. You’ll recall, that I recommend using products that are soluble in both fuel and water – what I call: universally soluble. If you don’t remember why I prefer universally soluble, fuel treatment biocide, please re-read Part 21.
In today’s post, I’ll discuss how to get the most effective results when you treat a fuel system with a microbicide. Spoiler alert, I do not recommend simply dumping the minimum dose (gal microbicide per gal fuel) into your system and hoping for the best.
Think strategically
Before treating a fuel system, ask yourself why you are adding microbicide. To many readers the answer will be obvious, but not necessarily correct. Yes, the objective is to kill microbes. However, have you first considered where the microbes are living, or how much biofilm has accumulated on fuel system surfaces? When you treat a heavily contaminated system, and biofilm sloughs off tank and pipe walls, where is it going to go? Is it reasonable to assume that a single dose will disinfect my system? How will you know if your treatment was effective? If you don’t think about these issues before you treat, you probably will afterwards.
Where are the microbes living?
Tank bottoms
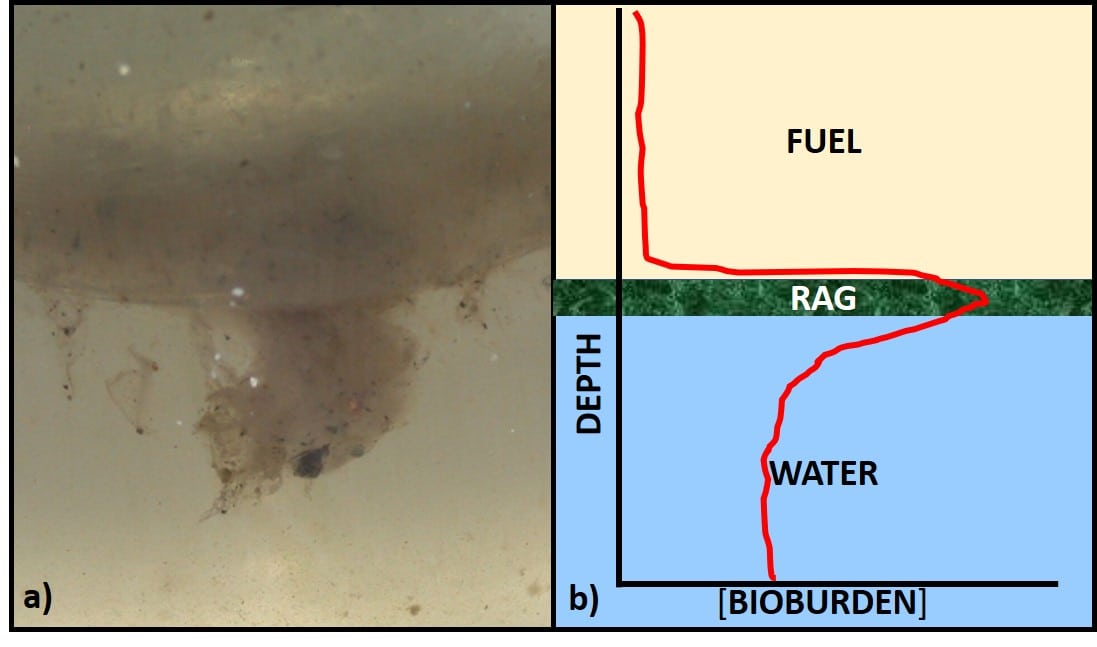
Most often we base fuel treatment decisions on test results from bottoms samples. Growth at the fuel-water interface can be seen either as an invert (water in oil) emulsion (rag-layer), membrane-like layer (pellicle), or both (fig 1a). Profiles of bioburdens in fuel, interface, bottoms-water layers generally show that the greatest bioburden is in the interface layer (fig 1b).

Biofilms
In Part 15 (November 2017), I wrote about biofilms. Biofilms are complex, slimy residues that can form at the fuel-water interface (as in fig 1a) and on fuel system surfaces, including bottom-sludge and sediment. Among their numerous fascinating properties, biofilms can act like a slime fortress – preventing microbicides from reaching biofilm microbes.
Treatment objective(s)
Based on the previous section, it should now be clear that most commonly, the objective is to disinfect fuel system surfaces. Treated surfaces can include any combination tank walls, pipe surfaces, valves, meters, and pumps. Treated surfaces will not include the tank ullage zone. If fuel is not in direct contact with a surface, neither will the microbicide. I’ll discuss disinfecting ullage surfaces in my next blog post (Part 23). If only tank surfaces need to be disinfected, then static soaking can be sufficient. However, if the objective includes disinfection of other fuel system component surfaces, the treated fuel will have to be recirculated to ensure that they are exposed to the microbicide.
Dosing
Choosing the correct dose
Dosage is the volume of microbicide added per gallon of fuel (recall from Part 21 that I recommend against doing before removing bottoms-water). All microbicides list minimum and maximum dosages on their container labels. The minimum dose is based on laboratory tests that can provide optimistic results. I always recommend using the maximum permissible dose. Maximum dosage is based on the regulatory agency’s toxicological risk assessment of the microbicide’s active ingredient(s).
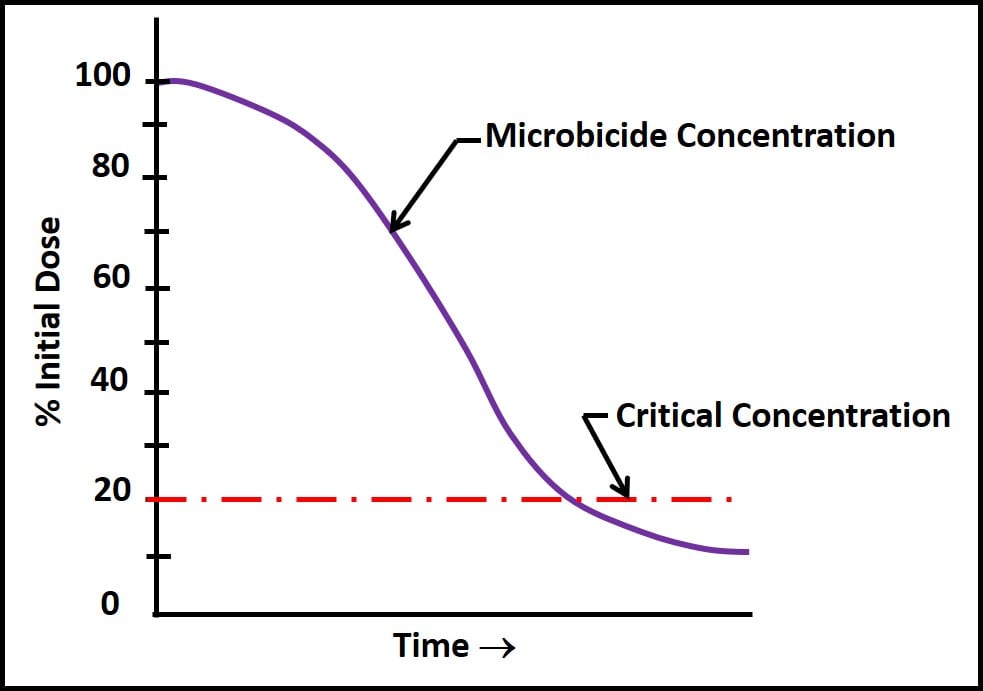
I recommend using the maximum permissible dose because the concentration of microbicide available to kill microbes begins to decrease once the product has been added to the fuel. Collectively, the factors contributing to the disappearance of microbicide active ingredient are called demand. There are chemical, physical, and microbiological demands. Figure 2 illustrates how microbicide concentration can decrease over time. The time axis in fig. 2 can range from hours to months.
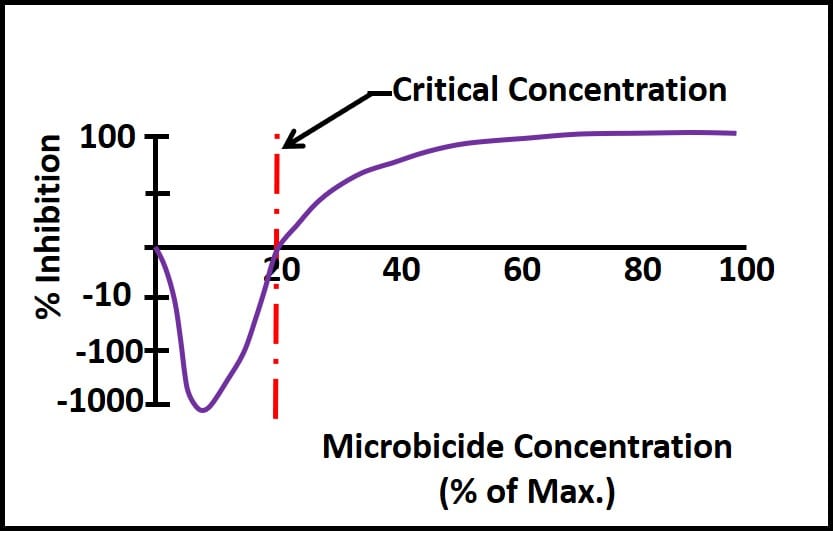
The most common physical demand is dilution. Each time untreated fuel is added to a tank containing treated fuel, it dilutes the microbicide concentration. Figure 3 illustrates what can happen once the microbicide concentration decreases to below its critical concentration – the minimum concentration at which the active ingredient is effective. Note how active ingredients that are quite effective when used as directed can actually stimulate growth once their concentration is less than the critical concentration. In fig. 2, microbial populations exposed to sub-critical microbicide concentrations are more than three orders greater than those in untreated systems. Conversely, at concentrations ≤50 % of the maximum permissible dose, the microbicide is fully effective.
Dosing plan
Although a single dose is often sufficient when treating a lightly contaminated system, it can be insufficient for disinfecting moderately to heavily contaminated systems. The reason is microbicide demand. An effective treatment exposes microbes to adequate concentration of active ingredient for a sufficient period of time (the soak period). The optimal soak period is between 24h and 48h. Except for long-term storage tanks, operators rarely have the luxury of allowing their fuel tanks to stand idle for this long. Depending on the fuel turnover rate, it might be necessary to add microbicide in order to maintain the active ingredient’s effective concentration for at least 24h (this is most commonly an issue at sites that receive more then one fuel delivery per day).
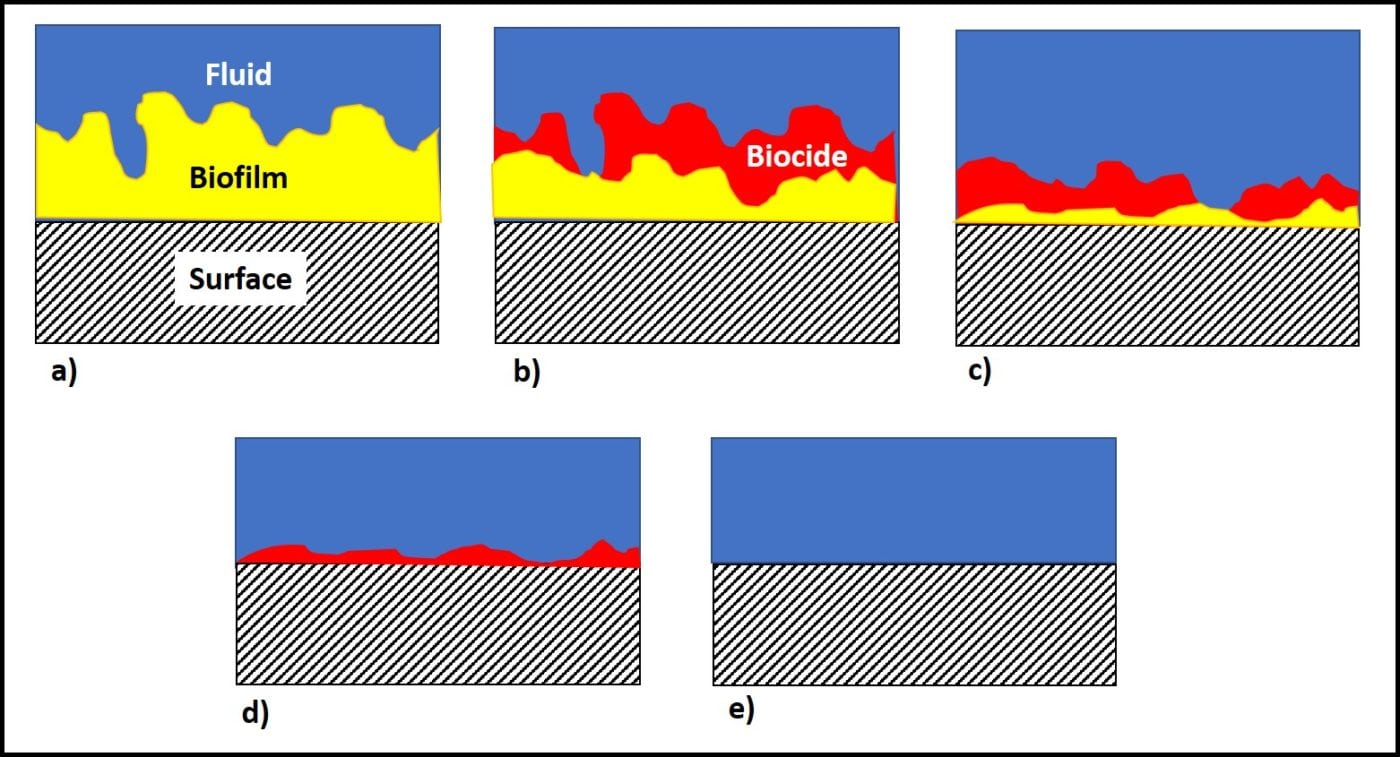
Additionally, active ingredients are used up as they react with microbes. The more heavily contaminated a tank is, the more quickly the available microbicide concentration will decrease. Figure 4 illustrates a point I made above, regarding biofilms. The initial treatment is unlikely to remove the entire biofilm or to kill microbes deep within the biofilm matrix. One or more follow-up treatments might be needed to fully eradicate the biofilm community (fig. 4c, d, and e). Each treatment will cause masses (flocs) of biofilm material to slough away from the surface to which it was originally attached. Some of these flocs will settle to the tank’s bottom. Those that don’t will remain suspended in the fuel and be transported to filters. Rapid filter plugging is a common result of effective biofilm destruction.

When tanks or sufficiently contaminated to cause filter plugging after biocide treatment, polishing, fuel tank cleaning or both should be part of the remedial effort. In part 23, I’ll write about fuel polishing and tank cleaning. In the meantime, if you have questions or comments about today’s post, please contact me at fredp@biodeterioration-control.com.
Disclaimer:
Microbes are ubiquitous. There are extraordinarily few habitats on earth where thriving, microbial communities have not been detected. In practical terms, this means that it is unlikely that operators will ever have a completely sterile fuel system or that they will reduce their fuel system biodeterioration risk to zero. Biodeterioration can still occur in the best maintained fuel systems. However, the risk of it occurring in an inadequately maintained system is much more likely


