Author Archive


Minimizing Covid-19 Infection Risk In The Industrial Workplace


Electron microscopy image of the SARS-CoV-2 virus.


COVID-19 Infection Statistics

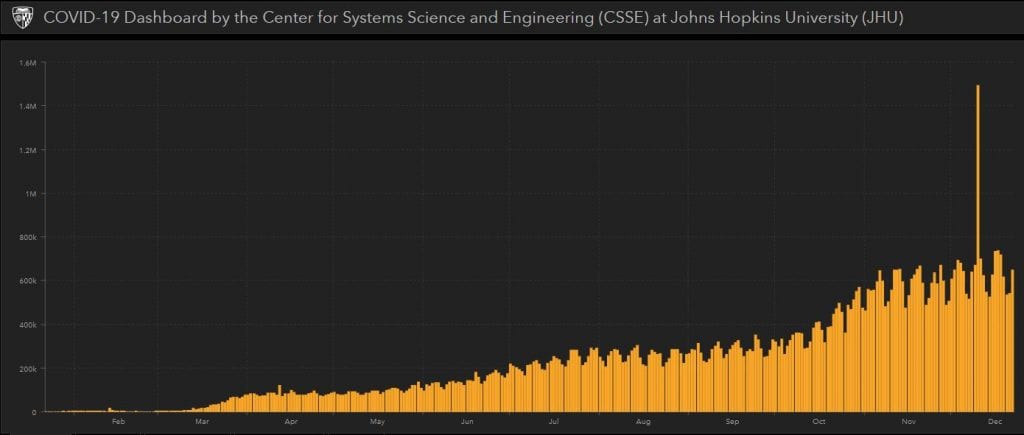
Although anti-COVD vaccines are rolling out and people are being immunized, as of early late December 2020, the rate at which daily, newly reported COVID-19 cases has continued to rise (Figure 1). In my 29 June 2020 What’s New article I discuss some of the limitations of such global statistics. In that post, I argued that the statistics would be more meaningful if the U.S. Centers for Disease Control’s (CDC’s) morbidity and mortality reporting standards were used. Apropos of COVID-19, morbidity refers to patients’ cases reported and having the disease and mortality refers to COVID-19 patients who die from their COVID-19 infection. Both morbidity and mortality are reported as ratios of incidence per 100,000 potentially exposed individuals. I illustrated this in my portion of an STLE webinar presented in July 2020.


Fig 1. Global incidence of new COVID-19 cases – daily statistics as of 23 December 2020 (source: coronavirusstatistics.org).


What Do the Infection Statistics Mean?

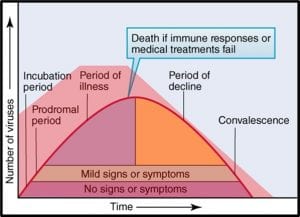
Social scientists, epidemiologists, and public health specialists continue to debate the details, but the general consensus is that the disease spreads most widely and rapidly when individuals ignore the fundamental risk-reduction guidelines. It appears that COVID 19 communicability is proportional to the number of SARS-CoV-2 virus particles to with individuals are exposed. Figure 2 illustrates the relative number of virus particles shed during the course of the disease.


Fig 2. Relationship between number of SARS-2CoV viruses shed and COVID-19 disease progression.


Notice that the number of viruses shed (or dispersed by sneezing, coughing, talking, and breathing) is quite large early on – before symptoms develop fully. It’s a bit more complicated than that, however. Not all infected individuals are equally likely to shed and spread the virus. All things being apparently equal, some – referred to as super-spreaders – are substantially more likely than others to infect others. Although people with or without symptoms can be super-spreaders, those who are infected but asymptomatic are particularly dangerous. These folks do not realize that they should be self-quarantining. A study published in the 06 November 2020 issue of Science (https://science.sciencemag.org/content/370/6517/691) reported that epidemiological examination of millions of COVID-19 cases in India revealed that 5 % of infected people were responsible for 80 % of the reported cases.

What Shall We Do While Waiting for Herd Immunity to Kick-In?

The best strategy for avoiding the disease is to keep yourself physically distanced form others. Unfortunately, this advise is all but worthless for most people. We use public transportation to commute to work. We teach in classrooms, work in offices, restaurants, medical facilities, and industrial facilities in which ventilation systems are unable to exchange air frequently enough to minimize virus exposure risk. The April 2020 ASHRE Position Document on Infectious Aerosols recommends the use of 100 % outdoor air instead of indoor air recirculation. The same document recommends the used of high-MERV (MERV – minimum efficiency removal value – 10-point scale indicating the percentage of 0.3 µm to 10 µm particles removed) or HEPA (HEPA – high efficiency particulate absorbing – able to remove >99.9% of 0.3µm particles from the air) filters on building HVAC systems. Again, as individuals who must go to work, shop for groceries, etc., outside our own homes, we have little control over building ventilation systems.

Repeatedly, CDC (Centers for Disease Control), HSE (UK’s Health and Safety Executive), and other similar agencies have offered basic guidance:

1. Wear face masks – the primary reasons for doing this is to keep you from transmitting aerosols and to remind you to keep your hands away from your face. Recent evidence suggests that that although masks (except for ones that meet N-95 criteria) are not very efficient at filtering viruses out of the air inhaled through them, they do provide some protection.

2. Practice social distancing to the extent possible. The generally accepted rule of thumb is maintaining at least 6 ft (1.8 m) distance between people. This is useful if you are in a well-ventilated space for relatively short periods of time but might be insufficient if you are spending hours in inadequately ventilated public, industrial, or institutional spaces.

3. Wash hands thoroughly (at least 30 sec in warm, soapy water) and frequently. The objective here is to reduce the chances of first touching a virus laden surface and then transferring viruses into your eyes, nose, or mouth.

Here are links to the most current guidance documents:

CDC – How to Protect Yourself and Othershttps://www.cdc.gov/coronavirus/2019-ncov/prevent-getting-sick/prevention.html

CDC – Interim Guidance for Businesses and Employers Responding to Coronavirus Disease 2019 (COVID-19), May 2020https://www.cdc.gov/coronavirus/2019-ncov/community/guidance-business-response.html

HSE – Making your workplace COVID-secure during the coronavirus pandemichttps://www.hse.gov.uk/coronavirus/working-safely/index.htm

UKLA- HSE Good Practice Guide – http://www.ukla.org.uk/wp-content/uploads/HSE-Good-Practice-Guide-Sept20-Web-LowresC.pdf – discusses health & safety in the metalworking environment.

WHO – Coronavirus disease (COVID-19) advice for the publichttps://www.who.int/emergencies/diseases/novel-coronavirus-2019/advice-for-public

Remember: Prevention really Means Risk Reduction

It is impossible to reduce the risk of contracting COVD-19 to zero. However, timely and prudent preventative measures can reduce the risk substantially so that people can work, shop, and interact with one another safely. Guidance details continue to evolve as researchers learn more about SAR-CoV-2 and its spread. However, the personal hygiene basics have not changed since the pandemic started a year ago. If each of us does our part, we will be able to reduce the daily rate of new cases dramatically, long before the majority of folks have been immunized.

For more information, contact me at fredp@biodeterioration-control.com

Sensitivity Training – Detection Limits Versus Control Limits


Meme from the 1986 movie, Heartbreak Ridge (Gunnery Sergeant Thomas Highway – Clint Eastwood – is providing sensitivity training to his Marines).


The Confusion

Over the past several months, I have received questions about the impact of test method sensitivity on control limits. In this post, I will do my best to explain why test method sensitivity and control limits are only indirectly related.

Definitions (all quotes are from ASTM’s online dictionary)

Accuracy – “a measure of the degree of conformity of a value generated by a specific procedure to the assumed or accepted true value and includes both precision and bias.”

Bias – “the persistent positive or negative deviation of the method average value from the assumed or accepted true value.”

Precision – “the degree of agreement of repeated measurements of the same parameter expressed quantitatively as the standard deviation computed from the results of a series of controlled determinations.”

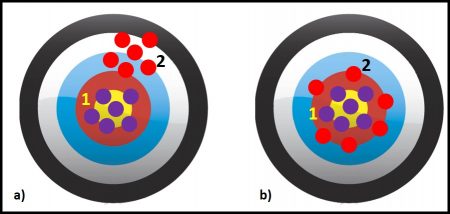
Figures 1a and b illustrate these three concepts. Assume that each dot is a test result. The purple dots are results from Method 1 and the red dots are from Method 2. In figure 1a, the methods are equally precise – the spacing between the five red dots and between the five purple dots is the same. If these were actual measurements and we computed the average (AVG) values and standard deviations (s), s1 = s2. However, Method 1 is more accurate than Method 2 – the purple dots are clustered around the bull’s eye (the accepted true value) but the red dots are in the upper right-hand corner, away from the bull’s eye. The distance between the center of the cluster of red dots and the target’s center is Method 2’s bias.


Figure 1. Accuracy, precision, and bias – a) Methods 1 & 2 are equally precise, but Method 2 has a substantial bias; b) Methods 1 & 2 are equally accurate, but Method 1 is more precise – the dots are clustered closer together than those from Method 2.

Limit of Detection (LOD) – “numerical value, expressed in physical units or proportion, intended to represent the lowest level of reliable detection (a level which can be discriminated from zero with high probability while simultaneously allowing high probability of non-detection when blank samples are measured.” Typically test methods have a certain amount of background noise – non-zero instrument readings observed when the test is run on blanks (test specimens known to have none of the stuff being analyzed).

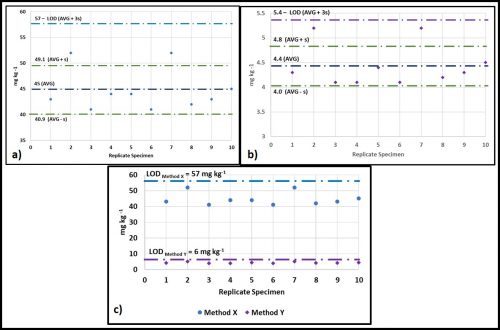
I have illustrated this in figures 2a through c. Figure 2a is a plot of the measured concentration (in mg kg-1) of a substance being analyzed (i.e., the anylate) by Test Method X. When ten blank samples (i.e., anylate-free) are tested, we get a background reading of 45 ± 4.1 mg kg-1. The LOD is set at three standard deviations (3s) above the average background reading. For test Method X, the average value is 45 mg kg-1 and the standard deviation (s) is 4.1 mg kg-1. The average + 3s = 57 mg kg-1. This means that, for specimens with unknown concentrations of the anylate, any test results <57 mg kg-1 would be reported as below the detection limit (BDL).

Now we will consider Test Method Y (figure 2b). This method yields background readings in the 4.1 mg kg-1 to 5.2 mg kg-1 range. The background readings are 4.4 ± 0.4 mg kg-1 and the LOD = 6 mg kg-1. Figure 2c shows the LODs of both methods. Because Method Y’s LOD is 48 mg kg-1 less than Method X’s LOD, it is rated as a more sensitive – i.e., it can provide reliable data at lower concentrations.


Figure 2 – Determining LOD – a) Method X background values = 45±4.1 mg kg-1 and LOD = 57 mg kg-1; b) background values = 4.4 mg kg-1 and LOD = 5.4 mg kg-1. Method Y has a lower LOD and is therefore more sensitive than Method X.

Limit of Quantification (LOQ) – “the lowest concentration at which the instrument can measure reliably with a defined error and confidence level.” Typically, the LOQ is defined as 10 x LOD. In the figure 1 example, Test Method X’s LOQ = 10 x 57 mg kg-1, or 570 mg kg-1, and Test Method Y’s LOQ = 10 x 6 mg kg-1, or 60 mg kg-1.

Type I Error – “a statement that a substance is present when it is not.” This type of error is often referred to as a false positive.

Type II Error – “a statement that a substance was not present (was not found) when the substance was present.” This type of error is often referred to as a false negative.

Control limits – “limits on a control chart that are used as criteria for signaling the need for action or for judging whether a set of data does or does not indicate a state of statistical control.”

Upper control limit (UCL) – “maximum value of the control chart statistic that indicates statistical control.”

Lower control limit (LCL) – “minimum value of the control chart statistic that indicates statistical control.”

Condition monitoring (CM) – “the recording and analyzing of data relating to the condition of equipment or machinery for the purpose of predictive maintenance or optimization of performance.” Actually, this CM definition also applies to condition of fluids (for example metalworking fluid concentration, lubricant viscosity, or contaminant concentrations).

Why worry about LOD & LOQ?

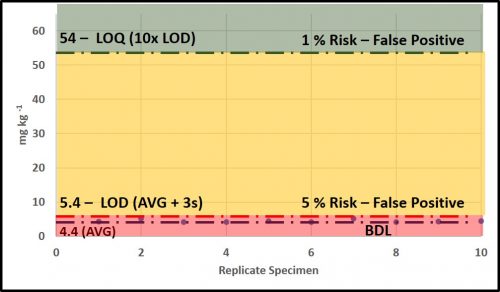
Taking measurements is integral to condition monitoring. As I will discuss below, we use those measurements to determine whether maintenance actions are needed. If we commit a Type I error and conclude that an action is needed when it is not, then we lose productivity and spend money unnecessarily. Conversely, if we commit a Type II error and conclude no action is needed, although it actually is, we risk failures and their associated costs. Figure 3 (same data as in figure 2c) illustrates the risks associated with data at the LOD and LOQ, respectively. Measurements at the LOD (6 mg kg-1) have a 5 % risk of being false positives (i.e., one measurement out every 20 is likely to be a false positive). At the LOQ (60 mg kg-1) the risk of obtaining a false positive is 1 % (i.e., one measurement out every 100 is likely to be a false positive). As illustrated in figure 3, in the range between LOD and LOQ, test result reliability improves as values approach the LOQ.

The most reliable data are those with values ≥LOQ. Common specification criteria and condition monitoring control limit for contaminants have no lower control limit (LCL). Frequently operators will record values that are LOD as zero (i.e., 0 mg kg-1). This is incorrect. These values should be recorded either as “LOD” – with the LOD noted somewhere on the chart or table – or as “X mg kg-1” – where X is the LOD’s value (6 mg kg-1 in our figure 3 example). In systems that are operating well, analyte data will mostly be LOD and few will be >LOQ. For data that fall between LOD and LOQ, a notation should be made to indicate that the results are estimates.


Figure 3. BDL (red zone – do not use data with values <LOD), >LOD but LOQ (amber zone – use data but indicate that values are estimates), ≥LOQ (green zone – data are most likely to be reliable).

Take home lesson – accuracy, precision, bias, LOD, and LOQ are all characteristics of a test method. They should be considered when defining control limits, but only to ensure that control limits do not expect data that the method cannot provide. More on this concept below.

Control Limits

Per the definition provided above, control limits are driven by system performance requirements. For example, if two moving parts need at least 1 cm space between them, the control limit for space between parts will be set at ≥1 cm. The test method used to measure the space can be a ruler accurate to ±1 mm (±0.1 cm) or a micrometer accurate to 10 μm (0.001 cm), but should not be a device that is cannot measure with ±1 cm precision.

Control limits for a given parameter are determined based on the effect that changes in that parameter’s values have on system operations. Referring back to figures 2a and b, assume that the parameter is water content in fuel and that for a particular fuel grade, the control objective was to keep the water concentration ([H2O]) < 500 mg kg-1. Method X’s LOD and LOQ are 57 mg kg-1 and 570 mg kg-1, respectively. Method Y’s LOD and LOQ are 5.4 mg kg-1 and 54 mg kg-1, respectively. Although both methods will detect 500 mg kg-1, under most conditions, Method Y is the preferred protocol.

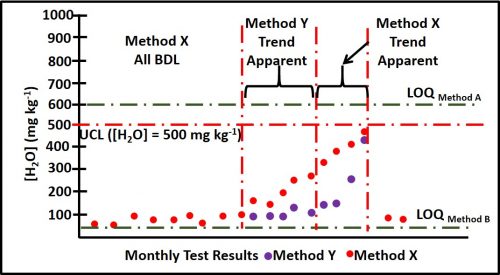
Figure 4 illustrates the reason for this. Imagine that Methods X & Y are two test methods for determining total water in fuel. [H2O] = 500 mg kg-1 is near, but less than Method X’s LOQ. This means that whenever water is detected a maintenance action will be triggered. In contrast, because [H2O] = 500 mg kg-1 is 10x Method Y’s LOQ, a considerable amount of predictive data can be obtained while [H2O] is between 54 mg kg-1 and 500 mg kg-1. Method Y data detects an unequivocal trend of increased [H2O] five months before [H2O] reaches its 500 mg kg-1 UCL and four months earlier than Method X detects the trend.

Note that the control limit for [H2O] is based on risk to the fuel and fuel system, not the test methods’ respective capabilities. Method Y’s increased sensitivity does not affect the control limit.


Figure 4. Value of using method with lower LOD & LOQ. Method Y is more sensitive than Method X. Therefore, it captures useful data in the [H2O] range that is BDL by Method X. Consequently, for Method X the reaction interval (period between observing trend and requiring maintenance action) is shorter than for Method Y and more disruptive to operations.

A number of factors must be considered before setting control limits. I will address them in more detail in a future blog. In this blog I will use jet fuel microbiological control limits to illustrate my point.

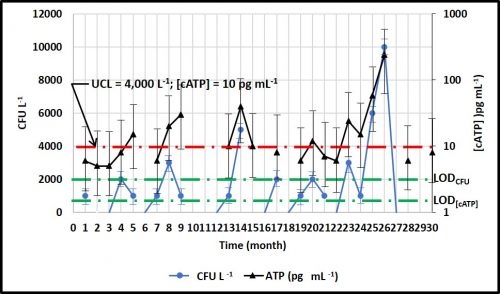
Historically the only method available was culture testing (see Fuel and Fuel System Microbiology Part 12 – July 2017 Fuel and Fuel System Microbiology Part 12 – July 2017). The UCL for negligible growth was set at 4 CFU mL-1 (4,000 CFU L-1) in fuel and 1,000 CFU mL-1 in fuel associated water. By Method ASTM D7978 (0.1 to 0.5 mL fuel is placed into a nutrient medium in a vial and incubated) 4,000 CFU L-1 = 8 colonies visible in the vial after incubating a 0.5 mL specimen. For colony counts the LOQ = 20 CFU visible in a nutrient medium vial (i.e., 40,000 CFU L-1). As non-culture methods were developed and standardized (ASTM D7463 and D7687 for adenosine triphosphate; ASTM D8070 for antigens), the UCLs were set, based on the correlation between the non-culture method and culture test results.

Figure 5 compares monthly data for culture (ASTM D7978) and ATP (ASTM D7687) in fuel samples. The ASTM D7979 LOD and LOQ are provided above. The ASTM D7687 LOD and LOQ are is 1 pg mL-1 and 5 pg mL-1, respectively. The figure 5, green dashed lines show the respective LOD. The D7978 and D7687 action limits (i.e., UCL) between negligible and moderate contamination are 4,000 CFU L-1 and 10 pg mL-1, respectively (figure 5, red dashed line). The figure illustrates that over the course of 30 months, none of the culture data were ≥LOQCFU . In contrast, 22 ATP data points were ≥LOQ[cATP] and five occasions, D7687 detected bioburdens >UCL when D7978 data indicated that CFU L-1 were either BDL or UCL.

Additionally, as illustrated by the black error bars in figure 5, the difference of ±1 colony in a D7978 vial has a substantial effect on the results. For the 11 results that were >BDL, but <4,000 CFU L-1, the error bars indicate a substantial Type II error risk – i.e., assigning a negligible score when the culturable bioburden was actually >UCL. Because D7687 is a more sensitive test, the risk of making a Type II error is much lower. Moreover, because there is a considerable zone between D7687’s LOQ and the UCL, it can be used to identify data trends while microbial contamination is below the UCL.


Figure 5. Fuel microbiology data by ASTM D7987 (CFU L-1) and D7687 ([cATP] (pg mL-1). For 22 of 30 monthly samples [cATP] > LOD & LOQ, only 3 samples have [cATP] > UCL. For CFU L-1, LOQ (20,000 CFU L-1) = 5x UCL. Error bars show 95 % confidence range for each data point (for CFU the error bars are ± 1 CFU vial-1; ± 1,000 CFU L-1, and for [cATP] they are ±1 pg mL-1)

Summary

Accuracy, precision, and sensitivity are functions of test methods. Control limits are based on performance requirements. Control limits should not be changed when more sensitive test methods become available. They should only be changed when other observations indicate that the control limit is either too conservative (overestimates risk) or too optimistic (underestimates risk).

Factors including cost and level of effort per test, and the delay between starting the test should be considered when selecting condition monitoring methods. However, the most important consideration is whether the method is sufficiently sensitive. Ideally, the UCL should be ≥5x LOQ. The LOQ = 10x LOD and the LOD = AVG + 3s based on tests run on 5 to 10 blank samples.

Your Thoughts?

I’m writing this to stimulate discussion, so please share your thoughts either by writing to me at fredp@biodeterioration-control.com or commenting to my LinkedIn post.

U.S. EPA Hazard Characterization of Isothiazolinones in Support of FIFRA Registration Review

Quo Vadis – or Déjà vu All Over Again, or are metalworking fluid compounders, managers, and end-users once again being thrown to the lions?

The Short Version

A decade ago, the U.S. EPA’s Office of Pesticide Programs (OPP) issued their Reregistration Eligibility Decision (RED) on the most commonly used formaldehyde-condensate microbicide – triazine. In the triazine RED, the EPA limited the maximum permissible active ingredient concentration in end-use diluted metalworking fluids (MWFs) to 500 ppm (0.5 gal triazine per 1,000 gal MWF). Before the 2009 RED was issued the maximum permitted triazine concentration was 1,500 ppm (1.5 gal triazine per 1,000 gal MWF). Triazine is generally ineffective at 500 ppm, so the RED limited triazine use to ineffective concentrations. Now EPA has started along the same path with isothiazolinones – the use of which increased substantially as MWF compounders scrambled to find substitutes for and supplements to triazine. In this post I report about EPA’s isothiazolinone risk assessments and discuss their potential implications. At the end of this article I have provided a call to action. The U.S. EPA’s comment period will close on 10 November 2020. If you want to be able to continue to use isothiazolinones in MWFs, write to the U.S. EPA and let them know of your concerns. If you do not take the time to write now, you will have plenty of opportunity to be frustrated later.

Sordid Background, Act 1

In February 2009, in their RED for triazine (hexahydro-1,3,5-tris(2-hydroxyethyl)-s-triazine), the OPP limited the maximum active ingredient (a.i.) concentration in metalworking fluids (MWF) to 500 ppm1. Triazine is a formaldehyde-condensate. This means is manufactured by reacting formaldehyde with another molecule – in this case, monoethanolamine at a three to one ratio (there are other formaldehyde-condensate microbicides produced by reacting formaldehyde with other organic molecules).

Formaldehyde is a Category 1A (substance known to have carcinogenic potential for humans) carcinogen2. EPA’s decision makers believed – contrary to the actual data – that when added to MWFs, triazine completely dissociated (split apart) to formaldehyde and monoethanolamine. In drawing this conclusion, EPA ignored data showing that in the pH 8 to 9.5 range typical of MWFs, there was no detectable free-formaldehyde in solution. They ignored data from air sampling studies that had been performed at MWF facilities3. They misread a paper that reported that triazine was not effective at concentrations of less than 500 ppm4. Triazine was to have been the first formaldehyde-condensate microbicide RED – to be followed with REDs for oxazolidines and other formaldehyde-condensates. Determining that it was not financially worth their while to develop the additional toxicological data that the U.S. EPA was likely to request, several companies who had been manufacturing formaldehyde-condensate products withdrew their registrations. Consequently, with their decision to reduce the maximum concentration of triazine to 500 ppm, the U.S. EPA effectively eliminated most formaldehyde-condensate biocide use in MWFs. I have discussed the implications of this loss elsewhere5 and will not repeat the tale here.

Sordid Background Act 2

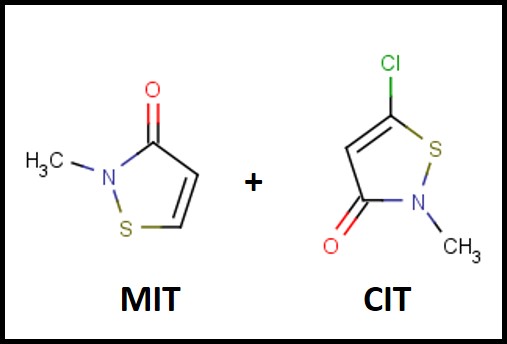
The first isothiazolinone microbicide – a blend of 5-chloro-2-methyl-4-isothiasolin-3-one (CMIT) and 2-methyl-4-isothiazolin-3-one (MIT – I’ll use CIT/MIT to represent the blend) – was introduced into the metalworking industry in the late 1970s (Figure 1). The original manufacturer – Rohm & Haas – knew that the product was a skin sensitizer (caused an allergic action on the skin of susceptible individuals) and took considerable efforts to educate users on how to handle the product safely. Moreover, CIT/MIT had already been in use as a rinse-off, personal product preservative, before it was marketed for use in MWFs. In the past decade, dermatitis complaints from CIT/MIT and MIT preserved personal care product users has received considerable publicity. All FIFRA6 registered pesticides are subject to periodic reviews – including risk assessments (hazard characterizations) and Reregistration Eligibility Decisions (REDs). Various research reports and toxicological studies are reviewed as part of U.S. EPA’s hazard classification process, but there is no indication that the actual incidence of adverse health effects is considered.


Fig 1. The chemical structures of the MIT and CIT molecules in the first isothiazolinone blend marketed as a microbicide for use in MWFs.

The 2020 Hazard Characterization of Isothiazolinones in Support of FIFRA Registration Review7

In April and May 2020, the U.S. EPA issued Registration Review Draft Risk Assessments for six isothiazolinones (Its). The CIT/MIT and MIT assessments were provided in one document, thus there were five risk assessment reports plus the hazard characterization. I have listed these in Table 1.

Table 1. U.S. EPA Isothiazolinone Draft Risk Assessments
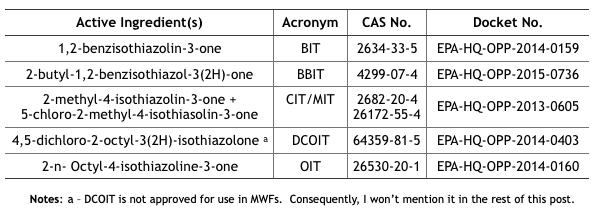
Note a – DCOIT is not approved for use in MWFs. Consequently, I won’t mention it in the rest of this post.

Despite toxicological data to the contrary (have you read this phrase before?), EPA chose to evaluate all ITs together – based on their putatively similar structural and toxicological property similarities. The best news is that none of the IT-microbicides were found to be either carcinogenic or mutagenic. However, as a class, they were designated as Category I (corrosive) for eye irritation and Category I (corrosive) for skin irritation (except for BIT – which was classified as non- irritating – Category IV). Moreover, the risk assessments used results from laboratory studies to identify Points of Departure (POD) for inhalation and dermal health risks. A POD is a point on a substance’s dose-response curve used as a toxicological reference dose (see Figure 2). For the IT risk assessments, the POD was the LOAEL – the lowest observable adverse effect level).

Each risk assessment discussed the different types of exposure relevant to each IT end-use applications and types of users – i.e., residential handlers – adults and children, commercial handlers, machinists, etc. Exposures related to MWF-use were addressed as a separate category. For inhalation and dermal exposures, respectively level of concern (LOC) and margin of exposure (MOE) were considered. The isothiazolinone LOCs were their PODs. The MOE is the ratio of the POD to the expected exposure. If MOE ≤ LOC, it is considered to be of concern. If MOE > LOC, it is not of concern.


Fig 2. Toxicity test dose response curve. LOAEL is the lowest observable adverse effect level. NOEL is the no observable effect level. The linear model assumes that the NOEL is always at test substance concentration = 0. The biological model recognizes that most often NOEL is at a concentration >0. Dose can be a single exposure (for example, 1.0 mg kg-1 of test organism body weight) or repeated exposures (for example 0.1 mg kg-1 d-1). Response depend on what is being observed (skin irritation, lethality, etc.).

Isothiazolinone Inhalation MOEs

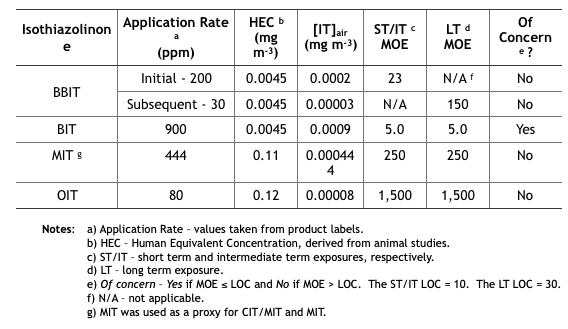
Table 2 summarizes the MWF inhalation MOE determinations from the five isothiazolinone (IT) risk assessments. These determinations are based on unsubstantiated assumptions.

  • First, IT concentrations in the air ([IT]air (mg m-3) were estimated based on EPA’s misunderstanding of how microbicides are used in MWF. EPA defined application rate as either initial treatment based on the maximum permissible dose as listed on the product’s label, and subsequent treatments as the minimum effective dose listed on the product label. These categories assume that all IT-microbicides are used only tankside and that subsequent treatments are driven by MWF turnover rates rather than biocide demand8. However, except for CIT/MIT, IT-microbicides are typically formulated into MWFs.
  • Next, [IT]air was estimated based on oil mist concentrations that had been measured at MWFs by OSHA during the years (2000 through 2009). During this period OSHA collected 544 air samples and computed the 8h time weighted average (TWA) oil mist concentration to be 1.0 mg m-3. The risk assessments did not provide a reference for the OSHA data, not did they indicate either the range of variability (standard deviation) of mist concentrations measured. Moreover – given that IT-microbicides are water-soluble, but not particularly oil-soluble – EPA’s use of oil mist concentration data was scientifically indefensible.
  • Compounding these two misperceptions, EPA calculated inhalation exposures by multiplying the assumed [IT] in the MWF by the average mist concentration. For example, if [MIT] in MWF is 444 ppm (mg IT L-1 MWF), then 444 ppm x 1.0 mg m-3 = 0.000444 mg m-3 (444 ng m-3, where 1 mg = 1,000,000 ng). As illustrated in Table 2, the short term (ST) and intermediate term (IT) inhalation exposure LOC for MIT = 10, and the long term (LT) LOC = 30.
  • Each IT’s MOE is computed from its 8h Human Equivalence Concentration (HEC – derived from animal toxicity data) and [IT]air: MOE = 8h HEC ÷ [IT]air (for MIT the HEC = 0.11 mg m-3 and [IT]air = 0.000444 mg m-3, so the MOE for MIT = 0.11 ÷ 0.000444 = 248, which rounds to 250). If you think this risk assessment seems to be based on an unacceptable number of assumptions, you are not alone.

Table 2. Risk Assessment Inhalation MOEs for Exposure to Isothiazolinone-Treated MWFs.
Isothiazolinone Dermal MOEs

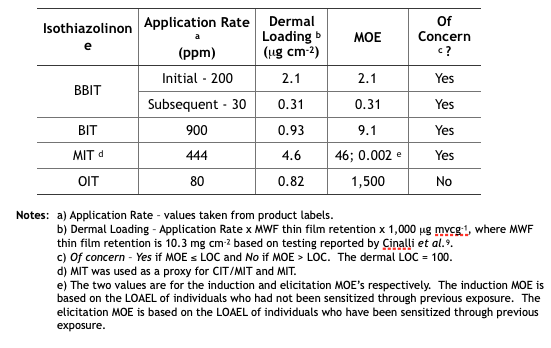
Table 3 summarizes the MWF dermal MOE determinations from the five isothiazolinone (IT) risk assessments. These determinations are based on the same unsubstantiated assumptions used to determine the inhalation MOEs.

Table 3. Risk Assessment Dermal MOEs for Exposure to Isothiazolinone-Treated MWFs.
Implications

Future Reregistration Eligibility Decisions (REDs) – as with triazine, EPA will use the risk assessments as the basis for the respective isothiazolinone (IT) REDs. The agency will most likely restrict end-use concentrations to levels that ensure Margins of Exposure (MOEs) are greater than Levels of Concern (LOCs). The only IT not likely to be affected is OIT. Its inhalation and dermal MOEs are in the not of concern range. In contrast, BIT’s inhalation and dermal MOEs are both of concern. We can anticipate that the EPA’s BIT RED will limit the maximum concentration in end-use diluted MWFs to a level that will ensure that both MOEs are greater than the respective LOCs. We can also anticipate that the maximum permitted BBIT, CIT/MIT, and MIT concentrations in end-use diluted MWFs to be reduced so that the dermal MOE is greater than the dermal LOC. With an elicitation MOE = 0.002 for CIT/MIT and MIT, it is possible that EPA will simply prohibit their use in MWFs.

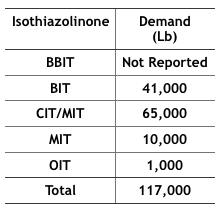
Economics – The 2012 Kline specialty biocides report10 projected that by 2017, 117,000 pounds of IT-microbicides would be used in MWFs in the U.S. (Table 4). In particular, BIT use has increased as a stand-alone microbicide and an active ingredient blended with one or more other active ingredients (for example BIT + triazine, BIT + sodium pyrithione, and BIT + bromo-nitro- propanediol – BNPD). The fate of these formulated microbicides could be affected by the new BIT RED.

Table 4 Projected, 2017, IT-Microbicide Demand for Use in MWFs (from IT product US EPA Risk Assessments).
If effective microbicides cannot be used to protect MWFs against microbial contamination a number of possible scenarios are likely to unfold. In the first, MWF functional life will be severely reduced. Systems that have been running for years without a need for MWF draining, cleaning, and recharging (D, C, & R), are likely to require D, C, & R multiple times per year. This will increase MWF and waste treatment/handling costs. In the second, MWF-compounders will modify their formulations to include molecules that are toxic but do not have pesticide registration. This potentially increased the health risk to machinists and other workers routinely exposed to MWFs. A third would be the increased use of biostable functional additives. The list of biostable functional products has grown substantially over the past two decades and is likely to accelerate as effective microbicide availability continues to shrink. Many currently available synthetic MWFs are quite resistant to microbial contamination. However, they are not suited to all metalworking applications. New applications research, using recently developed functional additives could close this applications gap. A fourth possibility is that MWF-compounders will try to adopt the intentional bioburden model used by one compounder. One MWF product line supports an apparently benign bacterial species whose presence seems to inhibit the growth of potentially damaging (biodeteriogenic) microbes. All of these scenarios translate to increased cost.

Health Issues – On countless previous occasions, I have discussed the potential health issues associated with uncontrolled microbial contamination (for my most recent paper – co-authored with Dr. Peter Küenzi – go to: tandfonline.com. There is some evidence that conventional mist collectors do not do a great job of scrubbing bioaerosols from plant air. MWF bioaerosols are whole cells and cell parts that come from the recirculating fluid and system surfaces. They cause or exacerbate allergenic and toxigenic respiratory disease. If MWF bioburdens cannot be controlled, MWF bioaerosols are likely to pose an increased worker health risk.

Problems with the U.S. EPA’s Isothiazolinone Risk Assessments and Call to Action

As I noted in my synopsis at the beginning of this post, the proposed risk assessment documents are open for comments until 10 November 2020. The U.S. EPA webpage provides instructions for how to submit comments to any or all of the risk assessment documents (dockets in EPA jargon).

Dr. Adrian Krygsman, of Troy has prepared talking points for industry stakeholders. I have previously had Dr. Krygsman’s talking points broadcast to ASTM E34.50 members and STLE metalworking fluids community members. I am copying it below in its original form:

* * *
Specific Comments on Metalworking Fluids:
U.S. EPA DRAFT RISK ASSESSMENTS: BIT-CMIT-OIT
Focal Points

A. General Comments on Approach:

  • According to EPA’s assessments there are concerns over the occupational risks associated with MWF’s due to inhalation and dermal exposure concerns. This is based on:
    • – Toxicological endpoints chosen for dermal and inhalation risk assessments (occupational and residential) are ultra conservative due to:
      • – Although there are separate databases for each IT EPA considers their overall response to be similar (corrosivity/irritation in sub-chronic studies) allowing them to interchange the most sensitive tox. Endpoints as needed per each individual assessment.
      • – Use of tox. Endpoints from other IT’s (e.g.- use of DCOIT inhalation threshold) for BIT.
      • – EPA uses a model to address spray mist levels of IT’s in air due to short term/intermediate term exposure.
      • – EPA addresses dermal exposure using their reliance on in-vitro/in chemico studies on IT’s. This approach, first validated in the EU for cosmetic products, using acute neural network approach and Repeated Open Insult Tests (ROAT) to set dermal thresholds for elicitation (that concentration which causes a skin reaction) and induction (period of time needed to induce a dermal allergic reaction). EPA is using an approach typically used for cosmetic products to create new thresholds for dermal exposure. Using this approach, no IT will pass their ultra conservative dermal exposure approach.
      • – EPA uses a dermal immersion model to conduct specific assessments for metalworking fluids.

B. Specific Comments

  • EPA has used maximum use rates in all of their assessments. Rates need to be checked.
  • EPA is misleading especially for CMIT/MIT by indicating 39 publicized adverse incidents. How many incidents of dermal rash or irritation are seen in the MWF industry?
  • Are the models EPA is using for MWF’s appropriate (e.g. dermal immersion model)?
  • EPA’s use of toxicological endpoints from other IT’s interchangeably. For example why choose DCOIT inhalation tox. Data for BIT? DCOIT is not a suitable surrogate for BIT. It is highly chlorinated versus BIT.
  • The IT Task Force is submitting human data to address EPA’s use of their non-animal data. Due to EPA’s reliance on this data they are obligated to account for intraspecies and interspecies differences (10X safety factors) resulting in a Margin of Exposure of 100X. Coupled with the low values obtained from their non-animal dermal studies it will be impossible to address dermal exposure effects, unless EPA validates this EU exposure approach before a scientific advisory panel (SAP). EPA considers their approach validated because experts in the EU have reviewed the approach and data. It has not been validated here.
  • The industry can not allow an assessment approach used for “leave-on cosmetics” to be used for regulation of industrial chemicals.
  • If PPE are incorporated into EPA’s assessments typical uses such as in-preservation of MWF’s still do not pass EPA’s dermal assessment. This is counter intuitive.
  • For CMIT/MIT EPA interchanges use rates of MIT at 400 ppm against CMIT/MIT values of 135 ppm.

C. Conclusion:

  • Major concerns have been raised for inhalation and dermal exposure from exposure to MWF’s. All IT’s assessed are problematic for these two routes of exposure. This is a function of EPA’s approach to group IT’s together and utilize an approach for dermal exposure which has never been used before.
  • The IT task force is combatting EPA’s approach for dermal assessment by submitting human sensitization data. This is the only way to show EPA this approach is wrong.
  • There are no concerns for environmental fate or ecotox. Effects.

Questions/Contact: Adrian Krygsman, Director, Product Registration
Troy Corporation
Email: Krygsmaa@Troycorp.com
Phone: 973-443-4200, X2249

* * *

Please send your comments and questions about this blog post to me at: fredp@biodeterioration-contol.com.

1 archive.epa.gov

2 IARC Monographs on the Evaluation of Carcinogenic Risks to Humans Volume 88 (2006), Formaldehyde, 2-Butoxyethanol and 1-tert-Butoxypropan-2-ol. https://publications.iarc.fr/106

3 Cohen, H.J. (1995), “A Study of Formaldehyde Exposures from Metalworking Fluid Operations using Hexahydro-1,3,5-Tris (2-hydroxyethyl)-S-Triazine,” In. J.B. D’Arcy, Ed., Proceedings of the Industrial Metalworking Environment: Assessment and Control. American Automobile Manufacturer’s Association, Dearborn, Mich., pp. 178-183.

4 Markku Linnainmaa, M., Hannu Kiviranta, H., Laitinen, J., and Laitinen, S. (2003), Control of Workers’ Exposure to Airborne Endotoxins and Formaldehyde During the Use of Metalworking Fluids, AIHA Journal 64:496–500.

5 Passman, F. J., (2010), Current Trends in MWF Microbicides. Tribol. Lub. Technol., 66(5): 31-38.

6 FIFRA – Federal Insecticide, Fungicide, and Rodenticide Act, 7 U.S.C. §136 et seq. (1996). https://www.epa.gov/laws-regulations/summary-federal-insecticide-fungicide-and-rodenticide-act

7 U.S. EPA (2020) Hazard Characterization of Isothiazolinones in Support of FIFRA Registration Review. https://beta.regulations.gov/document/EPA-HQ-OPP-2013-0605-0051

8 Biocide demand is the sum of all factors that decrease a microbicide’s concentration in a treated MWF. These factors include the microbes to be killed, chemical reactions with other molecules present in MWFs, evaporation (for volatile microbicide molecules), transport in MWF mist particles, drag-out, and dilution.

9 Cinalli, C., Carter, C., Clark, A., and Dixon, D. (1992), A Laboratory Method to Determine the Retention of Liquids on the Surface of Hands, EPA 747-R-92-003. https://nepis.epa.gov/Exe/ZyPDF.cgi/P1009PYK.PDF?Dockey=P1009PYK.PDF

10 Kline report: “Specialty Biocides: Regional Market Analysis 2012- United States” published April 3, 2013.

The Problem With Statistics – It’s Not The Statistics, But How We Abuse Them

Here’s a COVID-19 statistic – interpret it as you will…

A 23 June 2020 United Press International (UPI) headline in Health News (proclaims: “Less than half a population needs COVID-19 infection for herd immunity, study says.

The report goes on to state: “The modeling study found that herd immunity potentially could be achieved with about 43 percent of the population being immune, as opposed to the 60 percent estimate derived from previous models.” This is based on modelling work done by a member of the University of California-Riverside faculty. As I read the article my thoughts again turned to the observation about lies, damned lies and statistics (variously ascribed to Samuel Clemens, Benjamin Disraeli, and various other mid-19th century sources).

What population?

I’m not quibbling with the model used to compute the statistic, but do have an issue with how the article’s writer used it (note: having been misquoted on occasion, I cannot say that the statistic that appeared in the UPI article captured the cited investigator’s intent accurately. My issue is about granularity – the scale or level of detail present in a set of data or other phenomenon. I illustrate my point in figure 1. All of the images include New York City ranging from a satellite image (least granular) to an aerial photo of a single building on the northeast corner of 96th Street and 5th Avenue (most granular).

The 43 % statistic cited above is meaningless unless it incudes a statement about granularity. If applied globally, it ignores the possibility that in some countries, the majority of the population might be immune while in others, the percentage of immune individuals might be substantially less than the 43 % threshold for herd immunity. Moving across the granularity spectrum, will it be sufficient to consider 43 % immunity for an entire city, or will 43 % of the residents of each building need to be immune?


Fig 1. Granularity – moving from left to right, the images become more granular – provide a more detailed view of New York City.


Nowhere in the article was there any indication of the geographic area within which herd immunity would be achieved once 43 % of the population was immune to COVID-19. The result is a misleading article. Note that is possible to focus too closely on the details – as in missing the forest for the trees. My personal object lesson was having focused on a sea anemone (size ∼10 cm wide by 15 cm tall) while a whale swan directly over my head (figure 2 – not actual photos of the 1975 event). As I came out of the water, people asked if I had photographed the whale. I responded: “What whale?”


Figure 2. Missing the forest for the trees, or the whale for the anemone.


Herd Immunity and Physical Distancing

Guidelines from the Centers for Disease Control (CDC) and World Health Organization (WHO) indicate that we should maintain physical spacing of at least 6 ft (~2m) for other people to prevent transmission of the SAR-CoV-2 virus from communicable individuals to susceptible ones. If there are a group of people in a room – say a restaurant on a New York city block on which more than 43 % of the residents are COVID-19 immune – how will that affect physical distancing requirements? Based on the statistics cited in the UPI article, I have no idea. Apparently, nor does anyone else. There are simply insufficient data from which to draw an objective conclusion.

Statistics Abuse – There’s the Rub

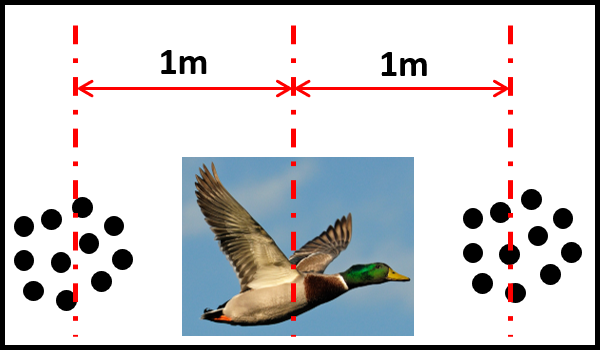
There’s an old joke about a duck hunter who fires his shotgun twice at a duck flying overhead (figure 3). His first shot flies past the duck, ∼1 m ahead of the bird and the second misses by the same distance behind it. The hunter proclaimed that one average (the midway point between the two shots) the duck was killed – except that it wasn’t (note: no ducks were harmed in the retelling of this statistics tale). Statistics is a branch of mathematics that provides elegant tools for distilling large amounts of data into useable form. That’s the science. The art is in marrying statistical analysis to other observations and logical thinking. Statisticians are the first to caution users to recognizes that their calculations are always in the context of probabilities. What is the probability that an apparent pattern (relationship) is simply random? What is the probability that a seemingly random pattern hides an important relationship? What is the impact of interpreting the statistics incorrectly?


Fig 3. One average the duck was shot. Statistically, the average of two volleys, equidistant in front of and behind the duck, would result in a kill.
 

What does this all mean?

Since my last post in May, epidemiologists and other public health experts have been trying their best to refine models for risks related to exposure to SAR-CoV-2, contraction of COVID-19, and alternative measures for ending the pandemic. In that in that post, I discussed risk versus hazard and the concept of acceptable risk. Within our free society, some citizens believe exposure to SAR-CoV-2 is an acceptable risk and have decided that no precautions are necessary. Recent spikes in the morbidity rate (i.e., number of new cases per 100,000 people in a given area) have reflected the wisdom (better: lack thereof) of ignoring the imperfect science. Presumably, at some point in the next few months, populations in many areas of the U.S. will approach the percent immunity targets identified in the UPI article. At that point, the risk of non-immune individuals contracting the disease will fall to a level that elected officials and business leaders deem acceptable. Will they be right or is acceptable risk in the eyes of the beholder?

I’m writing this to stimulate discussion, so please share your thoughts either by writing to me at fredp@biodeterioration-control.com or commenting to my LinkedIn post. Also, on 29 July at noon, Eastern Daylight Time, Dr. John Howell, Dr. Neil Canter, Mr. Bill Woods, and I will participate in an STLE webinar panel discussion on COVID-19 risk in the machine shop work environment.

SARS-CoV-2 (Severe acute respiratory syndrome coronavirus 2 – the virus that causes COVID-19) persistence in metalworking fluids

Does the SARS-CoV-2 virus persist in Water-Miscible Metalworking Fluids?

Over the past two months, I have received quite a number of emails and phone calls asking if water-miscible metalworking fluids (MWFs) were likely to be a source of SARS-CoV-2 virus exposure for machinists and others working in machine shops.

My short answer is that nobody really knows. I know that this answer is not particularly reassuring, but the test methods needed to test MWFs and MWF mists for SARS-CoV-2 in there types of samples do not yet exist. For companies and institutions developing test methods to detect SARS-CoV-2 the first priority has been identifying infected individuals. Given that most transmission seems to be via inhalation of aerosol droplets that carry virus particles, and that the aerosols of primary concern are those produced when someone sneezes, coughs, or speaks, investigating virus persistence in fluids was initially considered to be a less critical need.

However, for those working in the manufacturing sector, there is a history of adverse health effects – primarily allergies – caused by MWF aerosol exposure. Also, COVID-19 can be transmitted by touching a SARS-CoV-2 contaminated surface (i.e., contaminating the hands with viruses) then bringing the hands to the face. The virus can then be inhaled or gain entry through the eyes. If SARS-CoV-2 persists in MWFs, then machinists whose hands are in contact with the fluid and who then touched their face are at increased exposure risk. Additionally, machinists handle the parts that are to be machined. According to the European Centre for Disease Prevention and Control, SAR-CoV-2 an persist on copper surfaces for up to 4h, cardboard for 24h, and plastic or steel surfaces for up to three days. This means that there are ways COVID-19 can be transmitted at metalworking facilities.

Can we reasonably use what we know to assess the risk?

I believe that we can use the guidance provided by the Centers for Disease Control, (CDC) to minimize the incremental risk to machinists. Note that I am addressing incremental risk – that is the risk over and above our risk of contracting COVID-19 from our other activities. We are all at risk, however, all of the epidemiological studies that have been reported to date agree that social distancing reduces risk. To understand the incremental risk, we need to understand a few concepts:

Risk

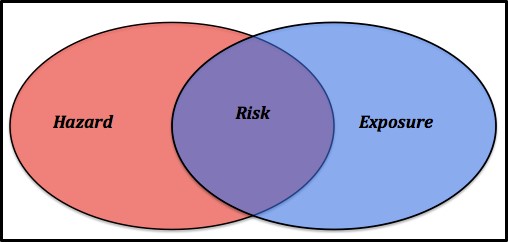
Risk is a function of hazard + exposure (R = H + E – Figure 1). This means that the most hazardous substance poses no risk if exposure is zero. All of the clinical and epidemiological studies that have been published since the first reports of COVID-19 in Wuhan, China last November indicate that SARS-CoV-2 virus is quite hazardous. Although the number of virus particles needed to cause a COVID-19 infection is not known, the ease with which the disease spreads from infected individuals to susceptible victims, the severity of many non-lethal infections, and apparent mortality rate (percentage of people who have contracted clinically reported infections and who ultimately die from the disease) demonstrate that SARS-CoV-2 is hazardous. Consequently, until a SARS-CoV-2 vaccine is developed, the primary means of reducing disease risk is isolation.

Fig 1. Venn diagram illustrating the relationship between hazards, exposure, and risk.

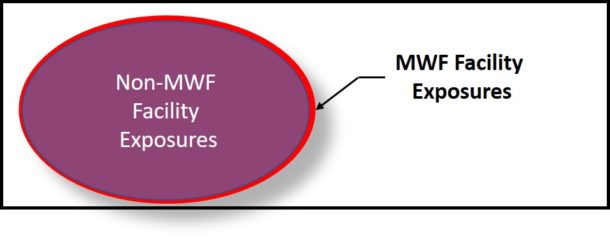
In many respects, the risks encountered at manufacturing facilities are identical to those related to the general population’s activities. For example, most people walk outdoors, handle doorknobs, groceries, appliances (computer, TV, smart phones, etc.), and generally expose themselves in countless ways. As depicted in Figure 2, this (blue ellipse) is our non-MWF facility exposure. For those who work at manufacturing facilities, there is some incremental exposure (red ellipse in Figure 2). Note, this is not to scale. We do not know the actual incremental risk.

Fig 2. Venn diagram illustrating incremental exposure of machinists and others at metalworking facilities.

Acceptable Risk

Risk is an objective concept. You can compute it if you know the hazard and the exposure (direct contact). Acceptable risk is purely subjective. The chances of dying in a plane crash are 1 in 11 million (0.000009 %) and of dying in a bathtub are 1 in 840,000 (0.0001 %). However, fear of flying represents an unacceptable risk to more people than fear of bathing does. Throughout the world today, we see the impact of differing opinions regarding risk acceptability playing out. At one extreme, people have placed themselves in complete isolation. At the other, people are ignoring all COVID-19-related personal hygiene and social distancing guidance. There is no broad consensus on the appropriate balance between measures to reduce the exposure risk and those taken to sustain the economy. One both sides of the argument, hysteria tends to take precedence over objective risk assessment. Intelligent, honest people can reasonably disagree on what constitutes an acceptable SARS-CoV-2 exposure risk. I will steer clear of that argument here but will note that as the COVID-19 pandemic has illustrated, risks rarely exist in isolation. Reducing one risk can easily increase another risk. In the case of COVID-19, decreasing the disease risk has increased the poverty risk for many people.

Viruses

Viruses are sub-microscopic (i.e., can been seen through an electron microscope but are too small to be seen through a light microscope – as seen in Figure 3, viruses are ∼0.001 times the size (volume) of bacteria and ∼0.000001 times the size of human cells). They contain genetic material enveloped in a coat. More than 6,000 different viruses have been identified (no doubt a tiny fraction of the different types of viruses that exist). Some – including SARS—CoV-2 – contain ribonucleic acid (RNA) and others contain deoxyribonucleic acid (DNA) as their genetic material. Virus coats can be protein or protein and lipid (Figure 4 shows the SARS-CoV-19 structure). Viruses can persist (i.e., remain infectious) but cannot multiply outside of susceptible (host) cells. Most viruses can only attack specific types of cells. The infection process starts with one or more viruses attaching to sites on the host’s cell wall. For SARS-CoV-2 viruses, the spike protein attaches to a cell. The virus then injects its genetic material into the host cell and the virus’ genes hijack the host cells’ genes – redirecting them to produce new viruses. Once the host cell is full of newly manufactured virus particles, it breaks open (lyses) to release the viruses into the environment surrounding it. If there are no susceptible cells to infect, a virus will eventually decompose. This is the basis for the persistence testing. When 3 days persistence is reported, that means that although the number of infectious viruses is decreasing from the moment they are deposited onto a surface, it takes 3 days for the number has decreased to below the test method’s detection limit (the detection limit is the minimum number/value that can be measured by a given test method).

Fig 3. Size scale – atoms to frog eggs.

Fig 4. SARS-CoV-2 virus schematic. A complex coat encapsulates the virus’ RNA.

Detecting viruses

Viruses are cultured by inoculating a layer of susceptible cells (i.e., a tissue culture) with a specimen containing viruses. As they infect the tissue culture cells, the viruses create clear zones – plaques – each of which contains billions of individual virus particles – virions (Figure 5). Viruses isolated by culture testing can then be used to develop other test methods. The most common methods are immunoassays (detect the presence of antibodies to specific viral antigens) and genetic tests (see my January 2018 What’s New posts for more detail explanations of antigen and genetic test methods).

At present the lower detection limit for SARS-CoV-2 virions is ∼2,700. A sneeze droplet from an infected person can carry millions of virions. That makes it relatively easy to detect the virus on contaminated surfaces or on a nasal swab sample. If that same sneeze droplet lands in 1 mL of fluid, the number of virions in that droplet are diluted 50,000-fold. As the ratio of the fluid volume into which someone has sneezed, coughed, etc. increases, so does the dilution factor and the difficulty of detecting viruses in the contaminated fluid. Consequently, to be detected in fluids (water, MWF, etc.) virus particles must first be concentrated. This concentration step is easier with fluids that have few contaminants (for example, potable water) than with complex, contaminant loaded fluids like MWFs. Consequently, it might be months or years before methods are developed to detect and quantify SARS-CoV-19 virus particles in MWFs.

Risk Assessment

Clearly, without data, assessing the risk of COVID-19 infection due to exposure in metalworking facilities is an exercise in speculation. However, because of the pandemic-related epidemiological studies that have been done for the general public and at food processing facilities, there is a basis for an educated guess.

Bioaerosol Exposure

Social distancing is the most effective way to reduce exposure. The general CDC guidelines apply equally well to personnel working in machine shops. Although mist collection systems have reduced MWF mist exposure, and the incidence of reported clusters of industrial asthma and other respiratory diseases has plummeted since the 1990s, when mist collection systems were installed at many metalworking facilities, there remains some question about how well mist collectors capture sub-micron diameter, bioaerosols. It is likely that there remains some risk of bioaerosol exposure, but there are insufficient data to define that risk. Generally speaking, recirculating MWFs act as bioaerosol reservoirs (i.e., the source) and MWF system biofilms act as MWF microbial contamination reservoirs. There have not been any reported studies of virus loads in MWF aerosols or virus presence or persistence in MWFs, so it is difficult to predict SARS-CoV-19 persistence in MWFs.

Some studies have been done to evaluate the COVID-19 risk to wastewater treatment plant operators. It has been reported that SARS-CoV-19 can persist for “2 days at 20°C, at least 14 days at 4°C, and survive for 4 days in diarrheal stool samples with an alkaline pH at room temperature.” (source: https://www.waterra.com.au/_r9550/media/system/attrib/file/2200/WaterRA_FS_Coronavirus_V11.pdf). Given that MWFs are alkaline and that the temperature of recirculating MWFs typically ranges between 30 °C (86 °F) and 37 °C (100 °F) it is likely that the virus will persist for 2 to 7 days in MWFs. Consequently, there is a risk that workers can be exposed to virus particles in MWF mist droplets.

Contact exposure

As noted above, the SARS-CoV-2 virus can persist on steel surfaces for up to 3 days. Consequently, handling parts that have become contaminated with virus particles within the previous 3 days poses an infection risk.

Risk Mitigation

Social distancing

Workers are typically standing shoulder to shoulder at food processing facilities where COVID-19 clusters have been reported. The distance between machines at metalworking facilities is more conducive to social distancing. Keeping at least 1.8 m (6 ft) distance between workers substantially decreases the risk of transmission among workers.

Mist control

Reduced mist exposure translates to reduced risk. If enclosures remain closed for at least 30 sec after MWF fluid flow is stopped, then the risk of mist inhalation decreases substantially. Equally important is mist collection system maintenance. To operate effectively, mist traps and reservoirs must be kept clean. Their surfaces should be disinfected after each leaning. High-efficiency particulate air (HEPA) filters installed at mist collect exhausts must be changed with sufficient frequency to prevent filters from becoming a source of bioaerosol exposure. Effective facility ventilation – including air flow and relative humidity control – will reduce virus persistence.

Personal protective equipment (PPE)

The role of appropriate PPE, properly worn and maintained, in preventing respiratory disease and dermatitis has been well documented. Workers likely to be exposed to MWF aerosols should wear air filtration masks that will prevent virus inhalation (i.e., meet or exceed capabilities of N-95 masks). Other masks help to remind individuals not to touch their face and trap aerosol droplets that they produce but do little to prevent them from inhaling virus particles that are in the air. Non-porous gloves can prevent direct contact with viruses that are on part surfaces. However, surgical gloves are likely to tear quickly when used to handle tools, machines, and parts. Recognizing that SARS-CoV-2 particles can persist on glove surfaces for several days, it is important to disinfect gloves with a hand sanitizer before removing them.

Personal hygiene

It seems that a substantial percentage of people with COVID-19 infections never show symptoms. However, these individuals can infect others. Effective personal hygiene practices can mitigate the disease transmission risk. Effective measures, as detailed by the CDC (see link above) include keeping hands away from the face and washing hands frequently – after each time a person touches any surface that might be contaminated with the SARS-CoV-19 virus. Applying a hand sanitizer can be an effective alternative to constant washing. The standard metalworking facility personal hygiene practices that have been advocated for decades also apply here. Workers should wear clean shop clothes. Street cloths should no be worn in the metalworking facility and work cloths should be cleaned by an industrial laundry service. Personnel should not eat, drink, or smoke before having washed hands thoroughly. Individuals should wash hands both before and after using the lavatories.

Bottom Line

Because workers are exposed to MWFs and parts, there is some incremental risk of SARS-CoV-2 exposure associated with working at metalworking facilities. Given that in contrast to food processing facilities there have been no reported COVID-19 clusters at machine shops, the incremental risk is likely to be small. Still, there are steps that owners, managers, and workers can take to minimize workplace-related incremental risk. Taking these measures can help maintain productivity while protecting workers from unnecessary COVID-19 risk. From the moment of birth to the moment of death, our lives are risk-laden. It is impossible to reduce risk to zero. However, by remaining mindful of potential sources of exposure and taking precautions to avoid bioaerosol inhalation, metalworking industry stakeholders can minimize the risk of workplace exposure.

Stay safe, productive, and healthy! Please send your comments and questions to me at fredp@biodeterioration-contol.com.

FUEL & FUEL SYSTEM MICROBIOLOGY PART 36 – Connecting the Dots, Part 4

Why do I sometimes detect heavy microbial contamination but no evidence that it is causing problems to my fuel system?

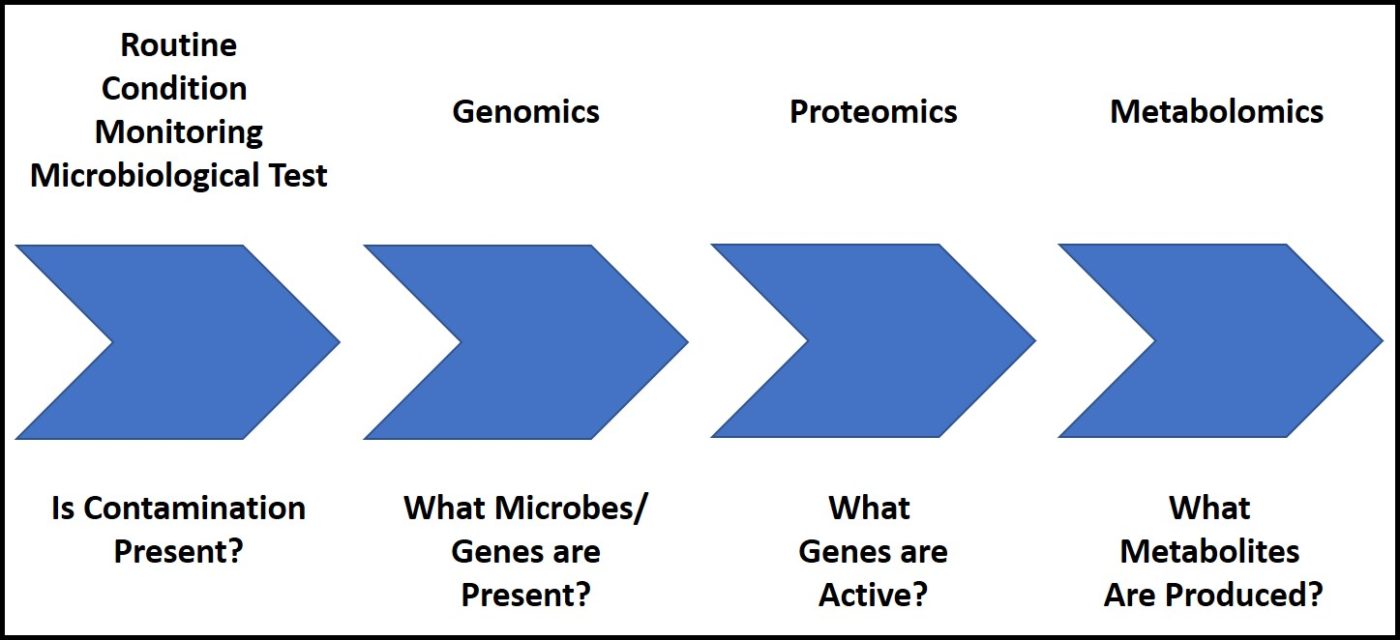
Explanations that I’ve provided in the last three articles provide some of the answers to this question. In this post I’ll address another issue – microbial activity. The various microbiological test methods I’ve described in this blog series have provide information about either whether microbes are present or what sorts of microbes are present. General culture tests and rapid methods determine whether microbes are present (see Parts 12, 13, 14 ). Typically, the raw data are assigned attribute scores – negligible, moderate or heavy contamination. This information is sufficient for routine condition monitoring. Selective growth media, enzyme-linked immunoabsorbent assays (ELISA – See Part 16) and genomic tests (see Part 17detect types of microbes (bacteria versus fungi, acid producers, sulfate reducers, etc.). Genomic testing can identify the types of microbes that are present more accurately and precisely that other methods can. However, none of these methods provide information about what microbes are doing.

Although methods can help determine what microbes are doing exist, they require more technical expertise than the previously mentioned tests. Moreover, the cost per test is still quite expensive ($500 to $1,000 per test). However, these emerging methods will be the tools we microbiologists will use to answer the question: “Why do I sometimes detect heavy microbial contamination but no evidence that it is causing problems to my fuel system?” and its complementary question: “Why do I sometimes observe substantial evidence of biodeterioration, but detect negligible to moderate microbial loads?”

Proteomics – the study of proteins

Proteins are long chains of amino acids. Proteins in cells are either enzymatic or structural. Enzymes are large protein molecules that function as cells’ machinery. The receive raw materials (i.e., nutrients) and produce products (i.e., cell building blocks). Proteomics uses analytical tools to determine what proteins are present in the sample. Each type of protein is only produced when the gene(s) that code for it are active. So, proteomics tells use which genes as active and which aren’t. This information can provide important clues as to what fuel system conditions might cause a nominally benign population to become aggressive.

Metabolomics – the study of what cells produce

As noted above, enzymes produce metabolites. Some metabolites are used to build new cells, others are used to maintain healthy, living cells, and many are excreted into the environment as waste products, signal molecules (this is how cells communicate) or external functional molecules (for examples include biosurfactants and extracellular polymeric substance – EPS, biofilm matrix). Metabolomic testing attempts to identify all of the metabolites produced by a microbial community. Indirect biodeterioration is caused by reactions between metabolites and the environment (i.e., fuel, fuel additives, and fuel system surfaces – in contrast, direct biodeterioration occurs when microbes use fuel or fuel additives as food). Metabolomics promises to tell us whether contaminant populations are producing metabolites that contribute to biodeterioration.

How do these omic tests help me answer my questions about the relationship between bioburden and biodeterioration?

Figure 1 illustrates the relationship among different types of microbiological tests. Each more sophisticated technology provides more detailed information about what is going on in the infected system.

Fig 1. Drilling down – the relationship between microbiological tests and information about biodeterioration processes.

In some respects, this is like zooming in using satellite imagery (figure 2). The high-altitude image (figure 2a) confirms that there is a land mass west of the Atlantic Ocean. This is analogous to microbiological tests used for routine condition monitoring. The next lower altitude image (figure 2b) shows that there are cities on this land mass. This is similar to the information obtain from genomic testing. Zooming in further, we see the general street layout of a city (Manhattan, NY in figure 2c). Knowing the street layout is similar to knowing which genes are active. As we approach ground level (figure 2d) we can see that the small dark spot just above the map pin in figure 2c is actually a reservoir (the Jacqueline Kennedy Onassis Reservoir) that is bordered by a path. Like metabolomic data, this image provides clues as to how the city functions.

Fig 2. Using satellite imagery (Google Earth) to get detailed infromation about a location – a) high-altitude image shows U.S. coastline from Massachusetts to Maryland; b) closer view showing contours of most of New Jersey, Southeastern New York, and Southwestern Connecticut; c) lower-altitude view reveals Manhattan’s streets and the rivers that make Manhattan an island; d) low altitude view shows Jacqueline Kennedy Onassis Reservoir in Central Park.

State of the Art

We know that not all microbial contamination poses the same risk, but we don’t know why some populations cause more damage or cause damage more aggressively than others.

Before 2010, there were few reports of genomic tests on fuel system samples. The few pre-2010 studies depended on culture testing to recover microbes for genomic testing. Consequently, our understanding of fuel microbiology was based on culture test results. During the past decade, microbiologists have exploited genomic test methods to better understand the types of microbe present in fuel systems and the relative abundance of different types of microbes in a given population (microbiome). Methods for performing proteomic and metabolomic tests on fuel and fuel associated water samples are in development. It will be several more years before these methods can be used with confidence. These methods promise to tell us why sometimes microbial contamination is a greater problem than it is at other times.

Because we do not yet have a full understanding of the relationship between bioburden levels (i.e.: negligible, moderate and heavy) and biodeterioration risk, we set conservative limits. The expense of acting when moderate or heavy microbial contamination is detected is a fraction of the cost of failing to control microbial contamination adequately. A colleague once estimated that the cost of taking a commercial aircraft out of service and disinfecting its fuel system was approximately $2 million U.S. What’s the cost of an aircraft falling out of the sky after fuel can no longer reach the engine? The relationship is similar for land-based emergency generator systems. Corrective maintenance actions to control microbial contamination typically cost between $500 U.S. and $2,000 U.S. When emergency generators fail to operate, the cost can easily exceed $100,000 U.S./min – not to mention the potential for catastrophic loss of lives (hospitals), equipment (nuclear power plants), or both.


The relationship between microbial contamination and fuel or fuel system damage is variable. BCA’s Microbial Audit collects climate, engineering, maintenance, and different types of test data (gross observations, physical, chemical, and microbiological) in order to assess given fuel system’s biodeterioration risk. As I observed at the beginning of this post, sometimes I find heavy microbial loads but no evidence of damage. At other times, even though microbiological tests are negative, the other results indicate severe biodeterioration is occurring. Until we have sufficient proteomic and metabolomic data from which to develop better diagnostic models, the prudent approach will be to continue to rely on the existing control limits recommended in guidance documents such as the Energy Institute’s Guidelines for the Investigation of the Microbial Content of Liquid Fuels and for the Implementation of Avoidance and Remedial Strategies and the International Air Transportation Association’s Guidance Material on Microbiological Contamination in Aircraft Fuel Tanks. A third document – Guidelines on Detecting, Controlling, and Mitigating Microbial Growth in Oils and Fuels Used at Power Generation Facilities (Energy Institute) – is in press. I’ll share details once the document has been published.

The details

For more details about understanding the relationship between microbiology test data and fuel or fuel system biodeterioration, please contact me at either fredp@biodeterioration.control.com or call 609.306.5250.

FUEL & FUEL SYSTEM MICROBIOLOGY PART 35 – Connecting the Dots, Part 3

Refresher from Parts 1 and 2: What do Microbiology Test Results Mean?

In my January and February Fuel & Fuel System Microbiology articles, I addressed two reasons why microbiology data do not always agree with other indicators of fuel or fuel system biodeterioration. Part 33 covered dilution effects. Although direct degradation of fuels can easily be demonstrated in 1 L jars with fuel over water, when a tank has more than 1 m3 (264 gal) of fuel over traces of water, the impact that microbes have on fuel near the fuel-water interface is undetectable because the affected fuel is diluted by the unaffected fuel. I followed the dilution effect discussion with an explanation of the non-uniform distribution of microbes in fuel systems (see Part 34). Negative (i.e., below detection limit – BDL) microbial test results might indicate that there weren’t many microbes in the sample but provide no guarantee that there were no microbial contamination hot spots elsewhere in the system. In today’s post I’ll discuss differences among microbiology test methods.

Do My Microbiology Test Results Tell Me Conclusively Whether Microbes are Damaging My Fuel System?”

The answer is still: no. Most often when I detect heavy microbial contamination in fuel systems, I also see evidence of biodeterioration. However, sometimes I don’t. There are time when I recover heavy microbial loads in my sample, but I find no evidence of damage. On other occasions, all of my non-microbiology observations indicate the biodeterioration processes are damaging the fuel, the fuel system, or both, but I’m unable to detect a significant bioburden. When I run several different microbiology tests, I reduce the chances of my failing to detect microbes when they are present in the sample.

Why Don’t All Microbiology Test Methods Give the Same Results?

Different Test Methods Measure Different Properties

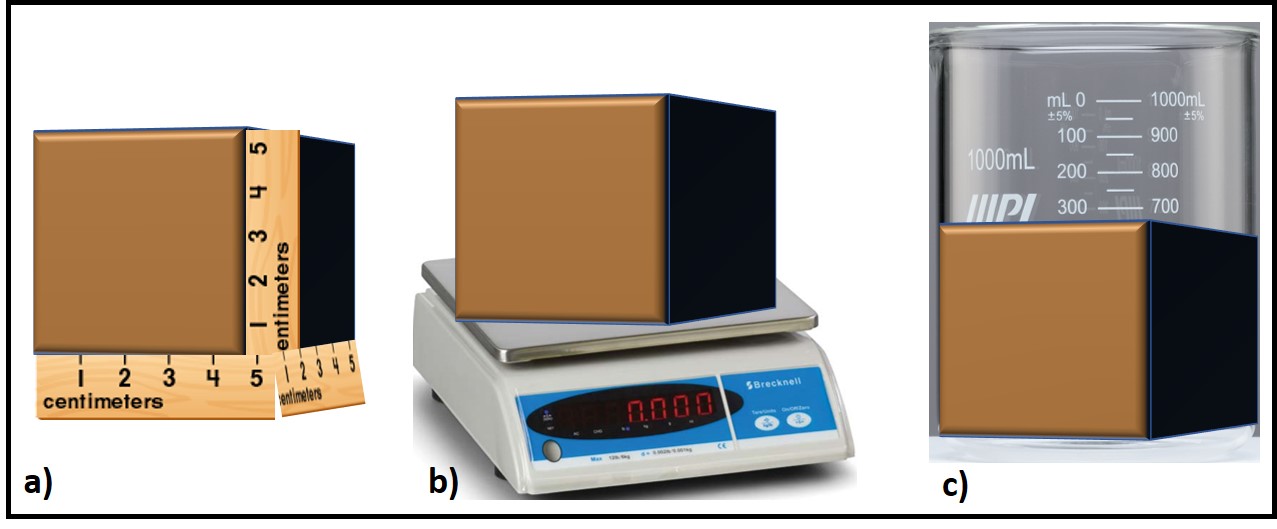
Consider a block of clay. Figure 1 illustrates three different measurement methods that can be used to determine how much clay there is. We can measure its length, width, and height to compute the block’s surface area. We can weigh the block to determine its mass. We can press the block into a graduated beaker to determine its volume (which – yes – was can also compute from the three linear measurements). All three approaches are valid, although each can be more appropriate than the others, depending on what you intend to do with the information. The same is true for microbiology test methods.


Fig 1. measuring a block of clay – a) surface area; b) mass; c) volume.

Most people responsible for fuel quality stewardship need microbiology test results that indicate whether or not corrective action is needed. The do not need a detailed description of the types of microbes present.

Microbiology Test Methods

There are three general types of microbiology test methods: direct count, culture, and chemical.

Direct Counts

Theoretically, direct count methods detect 100 % of the microbes present. However, dispersed water droplets and particulates can be incorrectly counted as microbes. Special stains can be used to determine whether the cells present are active or inactive. Organism-specific stains can also be used to determine whether microbes of concern are present. The main disadvantages for petroleum industry folks are the equipment (a good microscope), technical skill, and the amount of time (labor intensity) required to do direct counts.

Culture

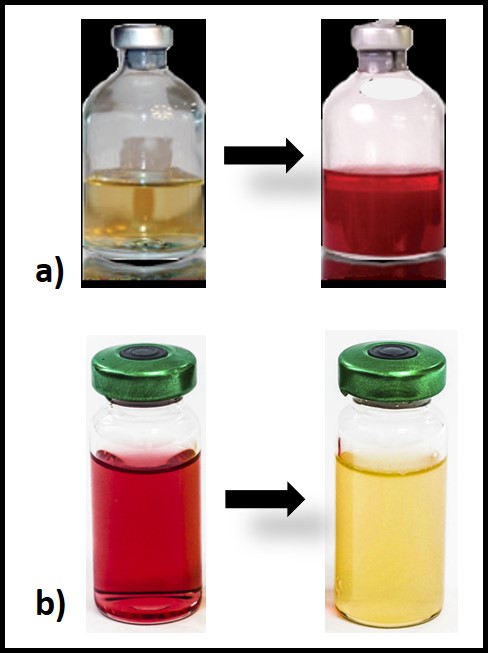
Culture tests require cells to proliferate (i.e., multiply) in a liquid (broth) or on a solid/semisolid growth medium. Proliferation in broth media is detected either by an increase in the growth medium’s turbidity or a dye’s color change. Figure 2 illustrates two types of both test kits. In figure 2a, the dye in the growth medium turns red when microbes proliferate. The number of days between inoculation and color change is used to estimate the bioburden in the original sample. Figure 2b illustrates a broth test for acid producing bacteria (APB). Typically, a series of three to five vials is inoculated – each being a 10x dilution of the one before it. If APB grow in the broth, its color will change from red to yellow. Each vial is scored positive or negative. The sample’s APB population density is computed based on the most diluted vial in which the color changed.

Fig 2. Broth culture media – a) general medium in which red color develops as cells proliferate; b) differential medium for APB, ed dye turns yellow as proliferating microbes produce acid.

As illustrated in figures 3a and 3b, microbes form colonies when the proliferate in or on solid media. ASTM D6469 (Standard Practice for Enumeration of Viable Bacteria and Fungi in Liquid Fuels—Filtration and Culture Procedures begins with a filtration step to trap microbes onto a membrane filter. The filter is placed onto a solid, nutrient agar growth medium. Proliferating microbes from colonies on the membrane’s surface (figure 3a). For ASTM D7978 (Standard Test Method for Determination of the Viable Aerobic Microbial Content of Fuels and Associated Water Thixotropic Gel Culture Method (figure 3b) a small inoculum is added to a semi-solid growth medium. Colonies develop as red circles. A commonly used culture test for detecting sulfate reducing bacteria (SRB) uses a vial filled with a selective, semi-solid growth medium that turns black if sulfate reduction occurs – i.e., when proliferate.

Fig 3. Microbial growth on or in solid/semi-solid media – a) colonies on a filter membrane; b) colonies in a thixotropic gel; c) selective growth medium for SRB turns black as SRB proliferate.

Culture testing is relatively easy to perform, but detection depends on two important factors. First, only microbes able to proliferate in the nutrient medium used will be detected. Second, detection depends on a microbe’s ability to proliferate in the medium in the time frame prescribed by the test method.

Proliferation is population growth. One cell divides to become two, two to four etc. There are thousands of different growth medium recipes. Each is designated to support the proliferation of some types of microbes. General media can be used to grow diverse microbes. Selective media might support the growth of a single type of microbe. Regardless of intent, there is no single growth medium on which all microbes can grow. This challenge is made even more difficult because some microbes require oxygen while others only proliferate in oxygen-free environments. Other factors such as pH, salinity, temperature, and others determine which microbes will proliferate. Consequently, microbes that are healthy and active in the system from which they were sampled might not be able to proliferate under the test conditions used for culturing them. In the 1970s and 80s when I was able to feed microbes radiolabeled nutrients, I routinely observed high levels of metabolic activity (for example microbes using C14-glucose to produce C – carbon dioxide, the end product of mineralization) in samples from which culture data on several different types of growth media were BDL.

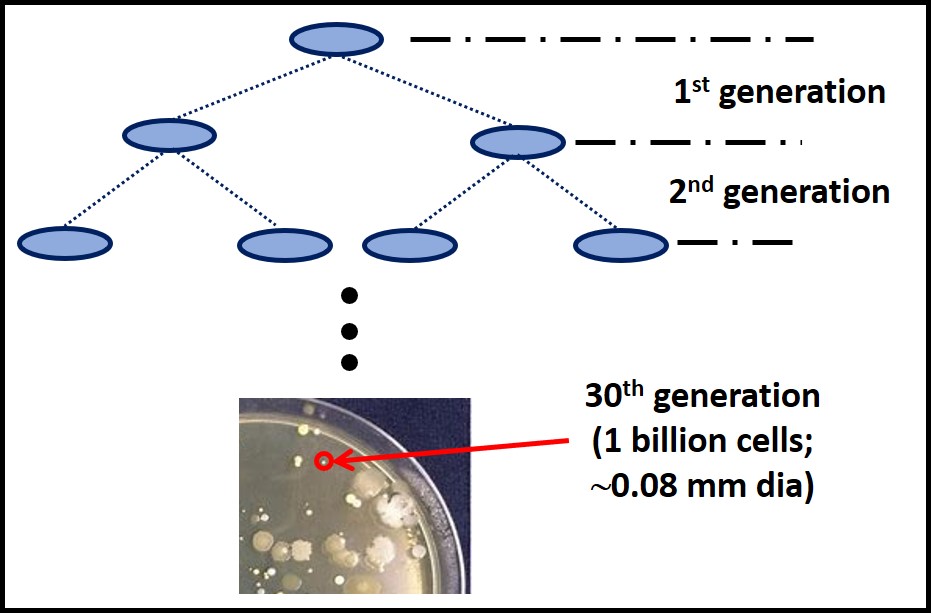
Inability to use the nutrients provided in the incubation environment is on issue. Generation time is the other. Generation time is time between cell divisions. Figure 4 illustrates this concept. During the first generation, one cell divides to produce two daughter cells. It takes 30 generations to accumulate enough cells to form a visible colony (i.e. a mass of cells with a diameter ≥0.08 mm) or 20 generations to make a broth visibly turbid. If a culture test is ended after 72h (3 days), only microbes with generation times ≤ 2.4 hours will be detected. Known microbe generation times range from 15 min to 30 days. Consequently, slower growing microbes that can proliferate in a given nutrient medium are likely to go undetected. Culture test results that might be positive after a week or two are erroneously scored as BDL.

Fig 4. Proliferation – each cell division cycle is one generation. It takes 30 generations for one cell to proliferate into a visible colony.

The generation time issue illustrates what I consider to be the primary factor that makes culture testing suboptimal for condition monitoring. If data are not available for several days after testing begins – not to mention delays between sampling and testing – necessary corrective actions are delayed. This delay is unlikely to cause substantially more biodeterioration in fuel systems but it will increase the cost of predictive maintenance (PdM – see Fuel & Fuel System Microbiology Part 5). 

Chemical Testing

All of the microbiology test methods fall into this broad category. I’ll discuss three categories here: adenosine triphosphate (ATP), enzyme-linked immunosorbent assay (ELISA), and genomic testing.

ATP is the primary energy molecule in all living cells. Bacterial cells contain 1 x 10-15 g (1 fg) of ATP per bacterial cell and ∼100 fg per fungal cell. Consequently, ATP concentration ([ATP]) is roughly proportional to the microbial population density in a sample. The original ATP test method – developed for testing water – proved to be unsuitable for brines and complex fluids such as fuels, lubricants, and oilfield produced waters. The protocol that was ultimately developed into ASTM D7687 Standard Test Method for Measurement of Cellular Adenosine Triphosphate in Fuel and Fuel-associated Water With Sample Concentration by Filtration is the only ATP test method that is not affected by these interferences (full disclosure – after 30 years of struggling to overcome the interference issue, I was involved with developing ASTM D7687). The D7687 ATP test only detects metabolically active cells. However, a variation of the basic test can be used to make dormant cells active and thereby determine whether a dormant population poses a future risk to the fuel system from which the sample was collected. Another test variation permits differentiation between bacterial and fungal contamination. The ASTM D7687 test can be completed in 5 min to 10 min and performed anywhere (I often run the test out of the back of my SUV). Because of its speed, precision, and accuracy, it is my preferred routine monitoring test method. Generally, ATP and culture test results agree. The ATP results from ∼15 % of 1,000s of samples I’ve tested indicate heavier contamination loads than those indicated by culture. Approximately 5 % of the time culture tests indicate heavier contamination. In the former case, D7687 is likely detecting microbes that would not proliferate under the culture test conditions used. In the latter case, culture testing most likely recovered microbes that were dormant in the sample but recovered once exposed to the culture medium.

Fig 5. ASTM D8070 LDF – a) LFD before use, showing two red lines – left line is control and right line is test; b) after specimen has been applied and given change to wet the test line – right line has disappeared, indicating presence of target antigen.

The ASTM D8070 test kit has six LDFs on a panel – two each for bacteria, total fungi, and the fungus Hormoconis resinae. One LDF of each pair detects moderate (33 μg ⁄mL to 166 μg ⁄mL) antigen concentrations and the other detects heavy (>166 μg/mL) concentrations. Like ATP testing ASTM D8070 can be completed in < 10 min. Although ASTM D8070 detects both active and dormant cells without differentiation between them, its results agree well with those obtained using ASTM D7687 ASTM D7687 s semiquantitative – given results in one of three ranges: <33 μg ⁄mL, ≥33 μg ⁄mL to 166 μg ⁄mL, and >166 μg/mL. Determining whether the test line has fully disappeared can be somewhat subjective. Decades ago, it was thought that H. resinae was the most common diesel fuel contaminating microbe. Although this has subsequently been disproven, the test kit manufacturer retains the H. resinae LFD – I suspect for sentimental reasons. D8070 is best used as a quick tool for determining if high [ATP] is due to bacterial, fungal or both types of microbes, rather than as a primary condition monitoring test.

Genomics is the branch of science focused on investigating genetic molecules – particularly deoxyribonucleic acid – DNA. In microbiology, genomic test methods use DNA extracted from a sample to determine what types of organisms are present. The key here is extraction. In order to get at their DNA, cells must first be broken open (lysed). If certain types of microbes in the samples are resistant to lysis, they won’t be detected. Consequently, the 80 % detection estimate for genomic testing assumes that in environmental samples, approximately 20 % of the cells present will not lyse. As lysing method improve, so should genomic test detecting percentages.

Currently, there are two general types of genomic tests used. Quantitative polymerase chain reaction qPCR) and next generation sequencing (NGS). Both methods use the enzyme DNA polymerase to generate millions of copies of the DNA molecules present in the original sample. qPCR methods are used to quantify specific genes, such as the dsrB gene present in all sulfate reducing bacteria. NGS looks at either 16S ribonucleic acid (RNA – bacteria), 18S RNA (fungi) or whole genome sequencing. Where qPCR can quantify the number of cells (actually copies of the target gene), NGS can provide a profile of all of the different types of microbes present. The great advantage of genomic testing is that the methods detect culturable and non-culturable microbes and identify the types of microbes present. Depending on the method used, detection can be fairly general (i.e., APB, SRB, etc.) or specific (i.e., H. resinae, Pseudomonas aeruginosa). I am currently evaluation the relationship between qPCR for total prokaryote (bacteria) and [ATP] (watch this blog for updates). Although field qPCR tests have recently become available, the level of information provided is more than that needed for routine condition monitoring. For now, genomic testing is best used as a follow-up diagnostic tool. NGS data is best used to prioritize target microbes qPCR test development.

Correlation Versus Agreement

A correlation is a linear relationship between two parameters. A good example of this is the relationship between two test methods use to measure bioburdens in a series of dilutions of an original sample. In this example, the types of organisms present is constant but the number of cells/mL varies linearly with the dilution factor. Figure 6a shows how each parameter decreases with increasing dilution factor. Figure 6b shows that the correlation between the two parameters is linear across the tested range.

Fig 6. Correlation between culture and ATP test results form serial dilutions of a heavily contaminated sample – a) each parameter plotted as a function of Log10 dilution factor; b) Log10 CFU/mL plotted as a function of Log10 [ATP].

In contrast, agreement refers to the likelihood that two parameters will lead to the same attribute score. For example, except for genomics, all of the microbiology parameters I’ve discussed in this article have recommended attribute scores: negligible, moderate, and heavy/high. Because each parameter measures a different aspect of the bioburden, agreement is more relevant than correlation. For example, in the ATP and ELISA test comparison mentioned above, results from 128 samples were compared. For 108 of the samples, both methods yielded the same attribute scores (84 % agreement). This degree of agreement indicates that both methods are providing reliable indications of fuel bioburdens.

Bottom Line

There is no best method for microbiology testing. Each serves an important purpose. Each has advantages and disadvantages relative to the others for different purposes. For example, although culture testing involves a long delay between initiating the test and having results, it is the only approach that provides isolated microbes for further study. Figure 7 is a Venn diagram illustrating the relationships among the different methods I’ve discussed in this post. Except for direct counts, which include erroneous counting of inanimate particles and water droplets, all of the methods detect some portion of the total microbiome. Note also the considerable overlap – i.e., agreement – among the methods. Still, there are regions where the circles do not overlap. It is in these regions that results from different methods are likely to not agree.

Fig 7. The relationships among microbiology test methods. The size of each circle indicates the estimated portion of the total microbiome detected. Disagreement among test results occurs where circles do not overlap.

Based on my field experience, I personally prefer ASTM D7687 for routine microbial contamination, condition monitoring testing. If I am doing diagnostic work, I’ll run additional microbiology tests to supplement high [ATP] results. Historically, I’ve run differential culture tests on samples with high [ATP]. As qPCR become less expensive, I’m beginning to replace differential culture with genomic testing. As I’ve written in previous blogs, as long as consensus standard test methods are being used, the relationship between microbiological data and other fuel and fuel system test data is more important than the relationships among different microbiology test results.

In Part 4 I’ll discuss the impact of specific microbial activities on the link between bioburden and biodeterioration.

The details

For more details about understanding the relationship between microbiology test data and fuel or fuel system biodeterioration, please contact me at either fredp@biodeterioration.control.com or 01 609.306.5250.

FUEL & FUEL SYSTEM MICROBIOLOGY PART 34 – Connecting the Dots, Part 2

Refresher from Part 1: What do Microbiology Test Results Mean?

In January’s Fuel & Fuel System Microbiology article I led with this question and commented that it is actually a double question. In one sense, it is asking: “Do my microbiology test results tell me conclusively whether microbes are damaging my fuel or fuel system?” In another sense, the question means: “Why don’t the results from different fuel microbiology test kits always agree?” I am then asked why often, even when microbiological test data indicate that there is heavy biocontamination present, the fuel does not seem to be affected. In today’s post – the second of three on this topic – I’ll discuss the relationship between microbiological test results and system damage.

Do My Microbiology Test Results Tell Me Conclusively Whether Microbes are Damaging My Fuel System?”

As I wrote, last month, the short answer is no. Keep in mind, all three of these posts about whether detected microbial contamination invariably signals biodeterioration is happening. This is different from the situation in which there are numerous indications of system biodeterioration, but microbiological test results are negative. I’ll revisit that issue in a future post.

Fuel System Biodeterioration

Biodeterioration is any damage caused by organisms. In fuel systems, the most common forms of biodeterioration are biofouling and microbiologically influence corrosion (MIC).

Biofouling is the result of microbes and the slime they produce (i.e., extracellular polymeric substance – EPS – the primary material in biofilms (see Part 15 for a refresher on biofilms) accumulating on system surfaces. When biomass accumulates on filters or screens, it restricts product flow. Figure 1 shows photographs of a dispenser filter, dispenser strainer, and leak detector strainer – each of which has become fouled with biomass.

Fig 1. Biofouling – a) dispenser filter; b) dispenser strainer; c) leak detector strainer.

Biofouling can also cause other problems including valves sticking or failing to close completely. When biofouling accumulates on the surface of an automatic tank gauge’s (ATG’s) water float (Figure 2a) the impact will depend on the biofilm. If the biofilm is filled with gas pockets, the float will be lighter than normal and will float within the fuel – giving a false signal that bottoms-water is present when it is not (Figure 2b). Conversely if the EPS is loaded with rust particles, the water float will be heavier than normal. It will rest on the tank bottom, even when 2 cm to 3 cm bottoms-water as accumulated (Figure 2c)

Fig 2. ATG water float – a) fouling on float’s surface; b) gas pockets in biofilm lift float into fuel-phase; c) rust particles in biofilm weigh-down float, preventing from floating above bottoms-water.

Biofilms coating vehicle fuel gauges will cause the gauges to give inaccurate readings.

Note that all of these biofilm accumulation zones are on system components. Fuel systems can have substantial bioburdens in tank bottom samples, but no biofouling. Although the possibility of fouling increases with increased bioburden in fuel tank bottom samples, detection of substantial microbial loads in fluid samples doesn’t necessarily mean that fouling has occurred. The only way to know for certain whether biofouling has occurred is by direct inspection of the fuel system components that are likely to become fouled.

Microbiologically influenced corrosion (MIC) includes any from of material damage that is caused either directly or indirectly by microbes. Most commonly, MIC is related to metallic components, but polymeric materials are also susceptible to MIC.

Contamination Detection

Connie Francis recorded Where the Boys Are as the title track for the 1961 movie of the same name. The next several paragraphs could be titled Where the Microbes Are. Microbial contamination is not a fuel property. Unlike fuel properties, the distribution of microbes in fuel systems is non-uniform (heterogeneous). The heterogeneous distribution of microbial contamination makes it difficult to collect a sample that is guaranteed to contain microbes – even if microbial contamination is present in the fuel system.

In my fuel microbiology courses I recount a lecture I heard as an undergraduate. My professor was part of the team tasked with developing a reliable test method for determining whether there was life on Mars. One member of the team suggested using a camera that would scan the horizon for signs of life. The device would scan 15 ° of arc at a time, completing a 360 ° scan each hour. The counterargument – illustrated in figure 3 – was that large life forms (elephants in figure 3) might be present but missed entirely because they continually moved out of the camera’s line of sight.

Fig 3. Not detecting the elephants – a) elephants are to the east while camera is pointing west; b) elephants are to the west while camera is pointing east. A researcher viewing the camera’s photo record would conclude that there are no elephants in the area photographed!

Now consider a 0.5 L (0.13 gal) sample collected from the bottom of a 38,000 (38 m3, 10,000 gal) tank. The sample represents 0.001 % of the total liquid volume in the tank. Similarly, a bottom sample from the bottom of a tank with a 31 m2 (31,000 cm2, 334 ft2) surface area draws in fluid, sludge, and sediment form a 3 cm to 5 cm radius. That represents 0.02 % of the total bottom surface area. Figure 4 illustrates how a two bottoms samples, taken from spots just a few cm apart, can have substantially different bioburdens.

Fig 4. UST bottom – biomass density heat map. Green zones have negligible biomass accumulation. Red zones have > 5 mm thick masses. Numbered blue circles are points from which bottom samples were collected. Distance between #1 and #3 ≈ 0.25 m (10 in). Microbial loads: #1 – below detection limits; #2 – moderate bioburden; #3 – heavy bioburden.
This is why I argue that a sample that yields negative microbiological test results provides much less information than one that yields positive results. You can get negative test results from samples taken in tanks suffering from severe biodeterioration damage. The converse is also true: it’s possible to detect substantial bioburdens in systems that show no indication of biodeterioration. In the latter case, the microbiology data triggers further checks. The cost of performing these checks is a fraction of the cost of post-failure corrective maintenance (i.e., tank replacement, site remediation, etc.).

Bottom Line

Fuel system samples used for microbiological testing are meant to be diagnostic – not representative. To be reliably diagnostic, samples must come from locations most likely to harbor microbes. This is can be impractical (if not impossible). Consequently, samples from systems with substantial fouling, MIC, or both can have negligible detectable bioburdens. Conversely, it is not uncommon for systems from which samples have apparently heavy bioburdens to have no biodeterioration symptoms. In Connecting the Dots – Part 3, I’ll write about why test results from different microbiology methods can lead to different conclusions. As I was writing today’s blog I decided to add a Part 4 – the impact of specific microbial activities on the link between bioburden and biodeterioration.

The details

For more details about understanding the relationship between microbiology test data and fuel or fuel system biodeterioration, please contact me at either fredp@biodeterioration.control.com or 01 609.306.5250.

FUEL & FUEL SYSTEM MICROBIOLOGY PART 33 – Connecting the Dots, Part 1

What do Microbiology Test Results Mean?

This is actually a double question that I hear quite often. In one sense, I’m asked: “Do my microbiology test results tell me conclusively whether microbes are damaging my fuel or fuel system?” In another sense, the question means: “Why don’t the results from different fuel microbiology test kits always agree?” Today’s post is the first of three in which I’ll write about how to make sense of microbiology data.

Do My Microbiology Test Results Tell Me Conclusively Whether Microbes are Damaging My Fuel or Fuel System?”

In a word: No. Let’s first consider fuel biodeterioration. In Part 2, I’ll write about system (infrastructure) biodeterioration. I’ll wait until Part 3 to explain why the results from different microbiology tests do not always agree.

Fuel Biodeterioration

In small microcosms, it is fairly easy to see the following fuel properties change due to biodeterioration:

  • Oxidative stability – decreases
  • Octane or cetane number – decreases
  • Carbon number distribution (simulated distillation curve) – shifts towards more complex molecules and molecules with more carbon atoms.
  • Corrosivity – increases
  • Total acid number – increases
  • Particulates – size and total number both tend to increase.

The larger the total fuel volume, the less likely these symptoms will be detectable. This is because the affected fuel is a minuscule fraction of the total fuel volume. Because the affected fuel is diluted in unaffected fuel, changes to the affected fuel become immeasurably small. Moreover, in high throughput systems, the contact zone between microbes and fuel is short – too short to give microbes time to attack the fuel. In long term storage systems, analysis are more likely to see differences between bottom fuel samples and those taken higher in the fuel column.

In addition to the dilution effect, in most fuel systems stratification and hydrodynamics create three primary zones. Figure 1 illustrates how a typical high throughput tank has three such zones.

Fig 1. UST hydrodynamic zones. Bottom 2 cm to 5 cm are stagnant. In the overlying 2 cm to 5 cm, turnover rate increases with distance from bottom. Above the transition zone the turnover rate is approximately the same throughout the tank. In a retail UST, this can be ≥5 turnovers/week.

This underground storage tank (UST) receives at least five deliveries per week. Consequently, fuel turnover in most of the tank is ≥5x/week. In most tanks the bottom several cm are stagnant (outside fill line scour zones). At the bottom of this zone, free-water and particulates accumulate so that they will not be drawn into the submerged turbine pump (STP) with clean product. Between the high turnover and stagnant zones there’s a transition zone. At the interface between this zone and the stagnant zone, turnover rates are negligible (see graph in Figure 1). As the distance from the tank bottom, the turnover rate increases until it is nearly the same as the high turnover zone. The transition zone is typically 2 cm to 5 cm thick, depending on the distance of the suction line’s inlet from the tank bottom.

The stagnant bottom-zone – where free-water, sludge, and sediment accumulate – is one of the regions where heavy bioburdens are most likely to be found. This is true for nearly all fuel tanks. When the fuel turnover rate is faster than 1x/month, fuel properties are unlikely to be affected by bottom-zone bioburdens. Thus, microbial test results indicating the need for immediate corrective action won’t be reflected in the results of tests run to determine whether the fuel is in specification. The longer fuel is stored (for example in emergency generator system fuel tanks, where fuel can be stored for years), the more likely it is that microbial activity will affect the fuel’s properties.

Notwithstanding the difficulty linking high bioburden results with fuel biodeterioration, bottom sample gross observations can be very helpful. Figure 2a shows a three-phase bottom sample. An invert emulsion zone (rag layer – fuel droplets dispersed in water) is most often a symptom of biodeterioration activity. When the rag layer adheres to the sample bottle’s surface (as in Figure 2b), you can be confident that the invert emulsion was caused by microbial activity. Microbes can produce detergent molecules called biosurfactants. Biosurfactant production can be tested quite easily. Place 5 mL of bottoms-water and 5 mL of fuel into a 50 mL polypropylene centrifuge tube and shake vigorously for 30 sec. Let the mixture stand for 15 min. If the phases separate cleanly, the results are negative (Figure 3a). If microbes have produced biosurfactant, a stable emulsion will form (Figure 3b).


Fig 2. Fuel separated from water by rag layer – a) invert emulsion stalactites (suspended from fuel into water) and stalagmites (extending up from bottom); b) rag layer adhering to sample bottle wall (highlighted by yellow dashed line).

Fig 3. Testing for biosurfactant production; two tubes 15 min after shaking – a) fuel and water have separated completely – no evidence of surfactant in sample; b) stable emulsion remains – microbial population has produced sufficient biosurfactant to produce this emulsion.

The details

For more details about understanding the relationship between microbiology test data and fuel or fuel system biodeterioration, please contact me at either fredp@biodeterioration.control.com or 01 609.306.5250.

FUEL & FUEL SYSTEM MICROBIOLOGY PART 32 – FUEL SYSTEM DISINFECTION REVISITED

Questions from a colleague

Today’s post was inspired by a text message I recently received from a colleague. His message contained two questions. First, he asked whether fuel tank microbicide treatment could select for resistant microbes. Second, he asked about how best to treat microbially contaminated fuel systems.

I addressed microbicide selection in Part 21 (July 2018) and treatment strategies in Part 22 (August 2018). Today’s post will include some content from these two earlier posts as I focus on the questions of microbicide resistance and effective dosing strategy.

The Short Answer

  • Microbes in fuel systems can become microbicide resistant.
  • The two most common reasons microbes become resistant are:
    • – Underdosing
    • – Inadequate exposure period (soak-interval).
  • To minimize the risk of a system developing resistant microbes:
    • – Use the maximum permissible dose when treating systems
    • – Don’t expect microbicide treatment alone to disinfect heavily infected fuel systems
    • – Repeat treatments until microbial population is adequately controlled.

What is Microbicide Resistance?

The news has contained an increasing number of reports about antibiotic resistant microorganisms (ARMs). If you are not familiar with ARMs, I recommend this Centers for Disease Control (CDC) webpage for an excellent overview of the issue. Briefly, ARMs are strains of disease-causing microbes (pathogens) that have mutated successfully to become tolerant (if not 100 % impervious) to a broad range of antibiotics. Almost invariably, antibiotic resistance is due to successful mutations. A mutation is a change in a cells’ genetic code. This change is passed along from one generation to the next. A successful mutation is one that enables the mutant to compete favorably against its non-mutant neighbors. In bacterial populations approximately one cell per million is a mutant but not all mutations are successful. When exposed to sub-lethal antibiotic concentrations, more cells within the target population are able to mutate successfully.

Remember that the generation times (time in which the population doubles) for bacteria range from 0.5h to several days. If an antimicrobial substance is repressing the growth of non-mutant cells but not mutants, it does not take long for the mutants to become the dominant population. Voilà, the treatable microbes have been replaced by resistant one.

Industrial microbicide (microbicide) resistance is a bit more complicated. There is still plenty of debate on which of two mechanisms is most common. There is considerable evidence that mutation – just as for ARMs – is one of the ways microbial populations become microbicide resistant. However, there is also evidence that by selectively killing the fastest growing microbes, microbicides can select for slower growing ones. This is a case of eliminating the competition. Non-oxidizing microbicides – i.e., all of the ones used for fuel-treatment – target cell components (i.e., enzymes, genetic material, cell wall molecules, etc.). Typically, non-oxidizing microbicides are most effective against rapidly growing microbes – the faster you eat, the more poison you ingest; the more poison you ingest, the faster you die. This means dormant and slowly growing microbes tend to be more bioresistant than their metabolically active neighbors. Dormant microbes (sometimes called persister cells) are similar to bacterial endospores – they are inactive – but do not have the definitive spore structure that characterizes endospores (figure 1).

Fig 1. Bacillus subtilis, spore stained, photomicrograph. Endospores appear as hollow, blue spheroids. Vegetative (i.e., metabolically active) cells appear as solid, violet rods.

Figure 2 illustrates the how slow growing microbes can become the dominant contaminant population after microbicide treatment kills all of the faster growing microbes. Before treatment, the slow growers (red cells) are a minor part of the total population dominated by fast-growers (blue cells) (figure 2a). Treatment kills all of the fast-growing cells but leaves most of the slow-growers intact (figure 2b). With their competition eliminated, the slow-growers eventually become the dominant population (figure 2c). Since these microbes were microbicide-resistant originally, they develop into a microbicide-resistant, contaminant population.

Fig 2. Effect of microbicide treatment on microbial population profile – a) fast-growing (blue) cells dominate before treatment; b) microbicide treatment kills the fast-growing cells while most of the slow-growers survive; c) without competition from fast-growers, slow-growers proliferate and become the dominant population over time.

Note, in this case, the resistant microbes were never fully susceptible to the microbicide used. They did not mutate in response to the treatment. Note also, resistance happens when a cell that has been exposed to a normally toxic concentration of the microbicide survives. As I’ll discuss below, microbicide treatment can be ineffective if the chemical does not come into contact with cells.

Insufficient Microbicide Concentration Impact

Figure 3 (this is a copy of figure 3 from Part 22) illustrates the impact of underdosing. The critical concentration is the minimum dose at which a microbicide has some kill effect. At concentrations less than the critical concentration, microbicides trigger increased metabolic activity and cell proliferation. The maximum permissible concentration for the microbicide used in figure 3 is 1,000 ppm (vol). At ≥600 ppm (60 % maximum) it does a good job of killing the target microbes. At 200 ppm it has no effect and at concentrations <200 ppm it stimulates growth (i.e. % Inhibition is <0). This phenomenon – called hormesis – doesn’t mean the population is healthy. The population is actually working hard to counter the poison’s effect. If you’ve ever seen Arsenic and Old Lace, you’ve seen an hormesis case study. There was a time when people used tonics containing arsenic as stimulants. Low doses seemed to increase user’s vigor, but higher doses – not surprisingly – were lethal.

Fig 3. Microbial population response to different microbicide doses (hormesis).
Insufficient Exposure Period Impact

In fuel systems, microbes are either suspended (planktonic – figure 4a) or embedded (sessile) within biofilms (figure 4b). Microbicide treatment typically makes short work of planktonic cells. This is because each cell is exposed to a lethal dose (figure 4c). However, microbicides are unable to reach cells that are embedded within a biofilm’s extracellular polymeric matrix (EPS – figure 4d). Note that cells near the EPS-bulk fluid interface are killed but those deep with the EPS matrix are protected. Figure 4 illustrates how a single treatment, using an effective microbicide, can fail to disinfect a system.

Figure 4. Microbicide efficacy against planktonic and sessile microbes – a) planktonic bacteria in bottoms-water; b) sessile bacteria in biofilm (EPS) on surface under bottoms-water; c) same as (a) but after microbicide dosing; all cells are exposed to the microbicide equally; d) same as (b) but after microbicide dosing; cells deep within the biofilm are not exposed to the treatment.

The commonly used fuel-treatment microbicide manufacturers recommend 24h to 48h soak periods. Given that most contamination develops on the bottom third of tank surfaces, dosing just before a fill should provide the recommended amount of contact time. This will effectively kill the planktonic population and cells within biofilms that are <2 mm (1/8 in) thick. For thicker biofilms, multiple treatments will be necessary. As illustrated in figure 5 (copied from Post 22) each time you add microbicide it will kill the microbes in, and disperse the EPS from, the biofilm’s outer surface. If microbicide is being used alone, it can require three or more treatments – each delivered three to five days after the preceding dose. In figure 5, three treatments were needed to achieve tank wall disinfection.

Fig 5. Using microbicide to disperse biofilm – a) biofilm accumulation on a surface; b) first biocide dose penetrates into the biofilm partially, causing some biofilm material to slough off; c) second biocide dose treats most of the remaining biofilm; d) third does disinfects surface; e) after effective treatment, surface is biofilm-free.

Does Disinfection Make Matters Worse?

Microbicides are developed to kill microbes, not to clean system surfaces. Best practice is to combine microbicide treatment with physical and chemical surface cleaning. If a system has substantial biofilm accumulation on its surfaces, microbicide treatment is likely to release chucks of biofilm and cells that will rapidly plug filters. For details on how to deal with this issue, refer to Part 23 on post-treatment system cleanup.

If linking microbicide treatment with system cleaning is not practical, the alternative is to treat repeatedly until:

  •    a) Masses of dispersed biofilm are no longer plugging filters, and
  •    b) Microbiological test results are below detection levels (negative).

The Details

For more details about disinfecting fuel systems, please contact me at either fredp@biodeterioration.control.com or 01 609.306.5250.

OUR SERVICES

  • Consulting Services
  • Condition Monitoring
  • Microbial Audits
  • Training and Education
  • Biocide Market Opportunity Analysis
  • Antimicrobial Pesticide Selection

REQUEST INFORMATION


    captcha