Archive for the ‘Uncategorized’ Category


FUEL & FUEL SYSTEM MICROBIOLOGY PART 31 – MATCHING THE SAMPLING TOOL WITH THE SAMPLING OBJECTIVE

Dixon Pumps Fuel System Broadcast Emails

The folks at Dixon Pumps dixon@dixonpumps.com routinely send out broadcast emails about fuel system maintenance. Today’s article was inspired by their 31 October 2019 email: Water Removal Basics, by Patrick Eakins. After the fourth paragraph, Mr. Eakins has an action list. The first action he recommends is:

“1. Determine the volume of phase (e.g. free water, ethanol) at the bottom of the tank. This can be accomplished by using a fuel sampler. First take a sample on the very bottom of the tank, then at 1-inch increments until you determine where the phase ends and the fuel begins.”

The phrase: “using a fuel sampler” caught my attention and will be this article’s focus. Spoiler alert: In Fuel Microbiology Part 30, I wrote about fuel system sampling. In this article be covering some – but not all – of the same material.

What Sampler?

The Dixon Pump article advises folks to use a sample but makes no mention of what kind of sampler is best for determining the height of free-water (or phase-separated ethanol and water) in underground storage tanks. The problem with an open statement like this is that the samples obtained by different types of samplers tell different stories.

Bacon Bomb Samplers

The Bacon bomb is probably the best, currently available bottom sample. Part 30, figure 2a shows a photo of a chrome-plated Bacon Bomb sampler. Figure 1, is a photo of a Bacon Bomb with a clear, polymeric cylinder (the cylinder is the sampler’s primary container). To make it easier to clean, the cylinder is threaded at each end so that the cap and bottom can be removed. The cap and plunger each have a hole for inserting a ring clip. To facilitate lowering and retrieving the sampler into tanks, a sounding tape can be attached to the cap’s ring. A secondary line can be attached to the piston’s ring for sampling above the tank’s floor (when the sampler is at the desired depth, the secondary line is pulled for approximately 30 sec to allow the sampler to fill. It is then released so that the piston is sealed against the sampler’s inlet).

Fig 1. Bacon Bomb sampler.

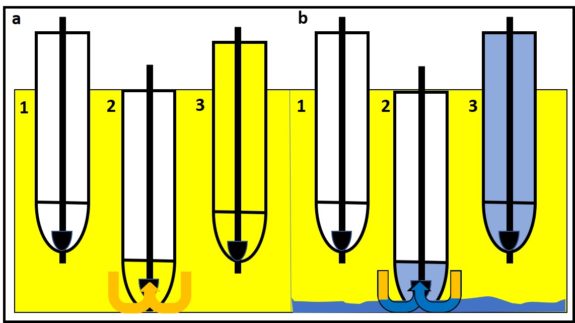
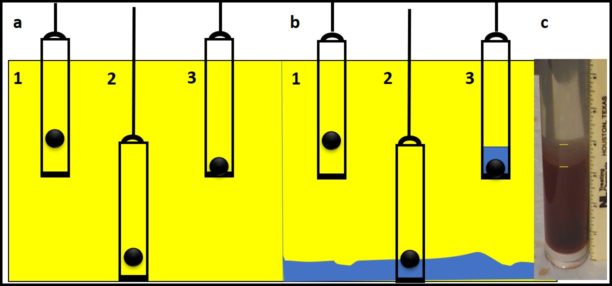
Figure 2 illustrates what happens when a Bacon Bomb sampler is used to collect a bottom sampler. The piston rests against the sampler’s inlet as it is lowered through the fuel column (figure 2a1 and 2b1). When the piston contacts the tank bottom, it is pushed up to open the inlet (figure 2a2 and 2b2). Hydrostatic pressure from the fuel column forces fluid into the sampler. When the Bacon Bomb is lifted off of the tank bottom, the piston will drop back into place – sealing it closed with the sample retained inside the cylinder. If there is no water or sludge present, the sampler will fill with fuel (figure 2a3). However, if bottoms-water is present, it will be the first fluid to enter the sampler. Thus, if there was 500 mL or water, and the Bacon Bomb’s capacity was 500 mL, the sample would be all, or nearly all water (figure 2b3). This would not be an accurate means for estimating the tank’s water level.

Fig 2. Bottom sample collection using a Bacon Bomb sampler. a) No water on tank bottom: 1) as sampler is lowered through fuel, the piston’s seat rests against the sampler bottom’s inlet, preventing fluid from entering; 2) when the piston touches the tank bottom and sample continues to fall, the inlet is opened and fluid enters – driven by the force of the fuel column’s hydrostatic pressure; 3) as the sampler is lifted off the tank bottom, the piston once again falls to reseal the sampler’s inlet – retaining the sampled fluid. b) Bottoms-water present: 1) same as a1; 2) any bottoms-water and sediment are pushed into sampler before any overlying fuel can enter; 3) same as a3, but now sampler is filled with water instead of fuel.

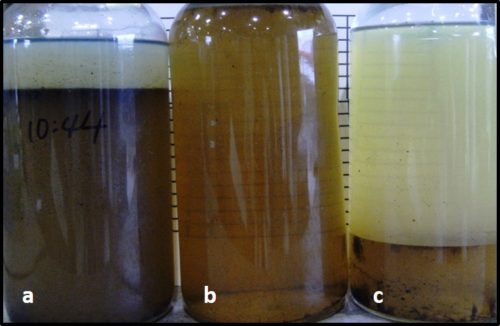
What does this mean in practical terms? Take a look at figure 3. Three, 500 mL Boston round bottles were filled from Bacon bomb samples collected from a tank bottom. The first sample (figure 3a) captured 450 mL bottoms-water and 50 mL of diesel fuel. If this had been used to estimate the water level, one might have concluded that the tank bottom was covered with a 5 in (13 cm) high water-layer. All 490mL of 500 mL from the second Bacon bomb sample (figure 3b) was bottoms-water. Was there actually 6.7 in (17 cm) of bottoms-water? The third sample (figure 3c) was mostly fuel. Three successive Bacon bomb samples from the same spot were sufficient to pull most of the water out of the tank. Water paste had shown that at the fill-end, the tank had 0.5 in (1.2 cm) of water.

Fig 3. Three successive Bacon bomb samples form one sampling point. A, b, and c were the fist, second, and third samples, respectively.

Bailer Samplers

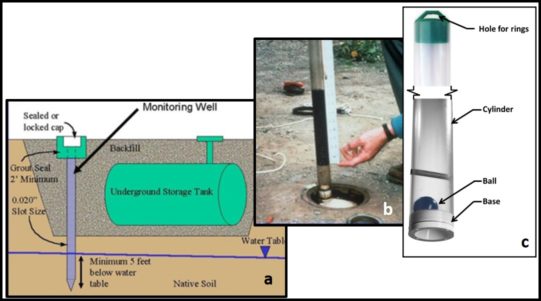
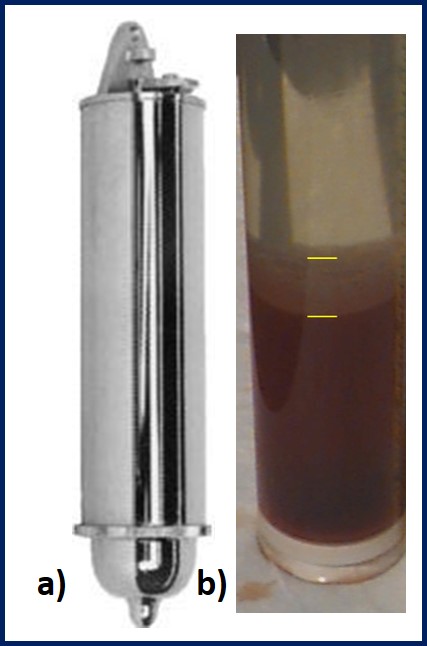
Bailer samples are normally used to collect fluids from monitoring wells. Figure 4a illustrates how monitoring wells are placed around underground storage tanks. Note that the bottom of the well is porous and at a depth below the water table. After sample collection, the contents of the bailer sampler are layered – reflecting the layering of fuel over ground water in the well (figure 4b – normally the sampler will contain only water). Figure 4c shows the primary components of a bailer sampler. There are numerous bailer designs. For sampling fuel tank bottoms, the sampler must be fabricated form fuel-compatible materials. Also, as shown in figure 4c, the bailer should have a flat bottom.

Fig 4. Monitoring wells and bailer samplers. a) schematic showing location of a monitoring well near a UST; b) bailer sampler retrieved from monitoring well – dark fluid next to ruler is leaked fuel that was captured in monitoring well; c) bailer sampler showing its key parts.

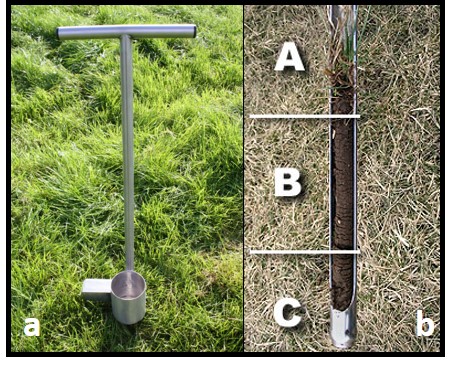
To collect bottom samples, the bailer is slowly lowered through the fuel column (figure 5a1 and 5b1) until it stands vertically on the tank floor (figure 5a2 and 5b2). Because it is not sealed as it descends through the fluid, it analogous to collecting a soil core sample (figure 6). Most bailer samplers have a ball that floats inside the cylinder as the sample is lowered, then settles to the base and seals the inlet as the sampler is raised (figure 5a3 and 5b3). As shown in figure 5c, just as with a soil core sample, the bailer sample reflects the profile of water, rag layer, and bottom fuel much as they are layered in the tank’s bottom. There is typically ∼0.25 in (∼1 cm) between the bailer’s bottom and the inlet. Consequently, bailer samplers are not good for collecting bottom sludge and sediment samples. However, they are useful for estimating bottoms-water height. The tank from which the figure 5c sample was taken had ∼3.5 in (∼9 cm) bottoms-water and 0.75 in (1.9 cm) thick rag layer. The water height in the sampler agreed well with that determined using water paste.

Fig 5. Bottom sample collection using a bailer sampler. a) No water on tank bottom: 1) as sampler is lowered through fuel, ball floats above sampler inlet; 2) when sampler comes to rest on tank bottom, the ball sinks to the inlet; 3) as the sampler is lifted off the tank bottom, the ball seals the sampler’s inlet – retaining the sampled fluid. b) Bottoms-water present: 1) same as a1; 2) water fills the sample to the level of bottoms-water in the tank; 3) same as a3, but now sampler has fuel over water; c) fuel tank bailer sample.
Fig 6. Soil core sampler. a) core sampler pressed into soil; b) soil core, showing three soil horizons: a – organic surface zone, b – surface soil, and c – subsoil.

Other Samplers

ASTM Practice D4057 describes other fuel samplers. However, none of these are useful for collecting true bottom samples.

Best Practice for Determining Height of Bottoms-Water Layer

As I explained in my previous fuel microbiology post, the best way to determine bottoms-water height is by coating either a sounding sick or bob with water paste and lowering it into the tank. The water will react with the paste to change its color. Because tanks are rarely level, best practice is to test for water at two – preferably three- points: fill end, ATG (automatic tank gauge well, and fill end).

The details

For more details about fuel tank bottom sampling and water accumulation determination, please contact me at either fredp@biodeterioration.control.com or 01 609.306.5250.

REMEMBERING A MENTOR AND A MENSCH – PROFESSOR EUGENE D. WEINBERG 1922 TO 2019

This morning, while reading the Fall 2019 issue of Indiana University Alumni Magazine, I was saddened to read Gene Weinberg’s name in the list of recently deceased IU faculty and staff.
Professor Emeritus Eugene D. Weinberg died on 08 March – less than a week after having celebrated his 97th birthday. Gene was the first academician to have had a profound effect on my life’s path. I know that his memory will be a blessing to all of us who had the privileged and pleasure of knowing him.

I first met Professor Weinberg in 1966 – a few weeks into my first semester at IU. My initial plan was to have been a math major, but within a month, I began to rethink that plan. Having been tinkering with microbiology since my parents made the mistake of presenting me with a microscope for my eighth birthday, I decided to explore the possibility of changing majors to microbiology. In late October 1966, I visited with Professor Weinberg in his Jordan Hall office to explore my options. He advised me that the courses that I was taking were perfectly aligned with those that would be part of a microbiology major. He contacted my original, math department advisor and agreed to become my faculty advisor. From that date through my graduation in June 1970, Gene was always available to offer guidance and to facilitate my efforts to perform extracurricular studies under various Microbiology Department professors. Although I never saw it, I have no doubt that Gene’s letter of recommendation helped me to get accepted into graduate school and receive a full fellowship for my studies at University of New Hampshire.

Gene’s research interest was in medical microbiology. Knowing that my passion was microbial ecology, while I was taking his course in Medial Microbiology, he encouraged me to make my class project ecologically focused. When I went home for Thanksgiving, 1968, I took a suitcase full of sterile, 100 mL glass bottles with me. One the Friday after Thanksgiving, I drove to the Delaware River’s source. From there, and at various bridges located at 50 mi intervals – ending at the Delaware Memorial Bridge, I used a fishing pool, jury-rigged sampling setup to collect samples from each bank and the middle of the river. I then carried the full bottles back to Bloomington (good thing this was before there were suitcase weight limitations or TSA) where I proceed to run culture tests and biochemical taxonomic profiles on each type of microbe that I had detected. I rationalized this survey effort by noting that there was a possibility that the taxonomic profiles along the river’s length might have been indicative of public health risks.

I didn’t realize it at the time, but that project marked the start of my career as a microbial ecologist. I did realize from the outset that Gene was a supportive, encouraging mentor. When others might have said: “you can’t do that!” Gene would always tell me that I had a great idea, asked me if I had thought about various details – which of course I hadn’t, and suggest research papers that might help me to refine my thoughts. Gene was one of perhaps four mentors whose influence shaped my career as a microbiologist. I feel most fortunate for having known him and have benefited from his wisdom, his kindness, and his mentorship.

You can find Gene’s full obituary article at https://www.hoosiertimes.com/herald_times_online/obituaries/eugene-weinberg-phd/article_f86ed715-7dde-5789-9916-40d1e0fb0bfe.html.

FUEL & FUEL SYSTEM MICROBIOLOGY PART 30 – looking for samples in all the right places

What samples are most useful for microbiological testing?

Earlier this week a colleague asked me to prepare a short piece about collecting samples from fuel systems when the intention was to perform microbiological tests. My initial response was to refer her to ASTM Practice D7463 Manual Sampling of Liquid Fuels, Associated Materials and Fuel System Components for Microbiological Testing and my recently published chapter on sampling in ASTM Manual 1, 9th Edition. My colleague responded that she was really looking for a two-page summary that she could share with her customer who wanted to monitor their fuel systems from microbial contamination. Today’s post provides that summary.

The right stuff…

I first addressed sampling in Fuel & Fuel System Microbiology Part 2 (December 2016) and discussed sample perishability in Fuel & Fuel System Microbiology Part 6 (January 2017), but have not previously addressed sampling directly in this posts. Two key principles lie at the heart of sampling for microbiological testing:

   1) 1. Fuel & Fuel System Microbiology Part 2Samples are diagnostic – not representative, and

   2) 2. Microbial communities develop at interfaces.

What’s a diagnostic sample?

Microbiological sampling is unique in that the objective is to capture a sample from a location that is most likely – within a fuel system – to harbor microbes. Our intent is to diagnose the risk of microbes causing damage (biodeterioration) to either the fuel or fuel system. This is in stark contrast to the more common objective of collecting a representative sample – one that we can use to determine whether the product is fit for its intended use. Consequently, I use the term diagnostic to differentiate microbiology samples from fuel samples.

What is an interface?

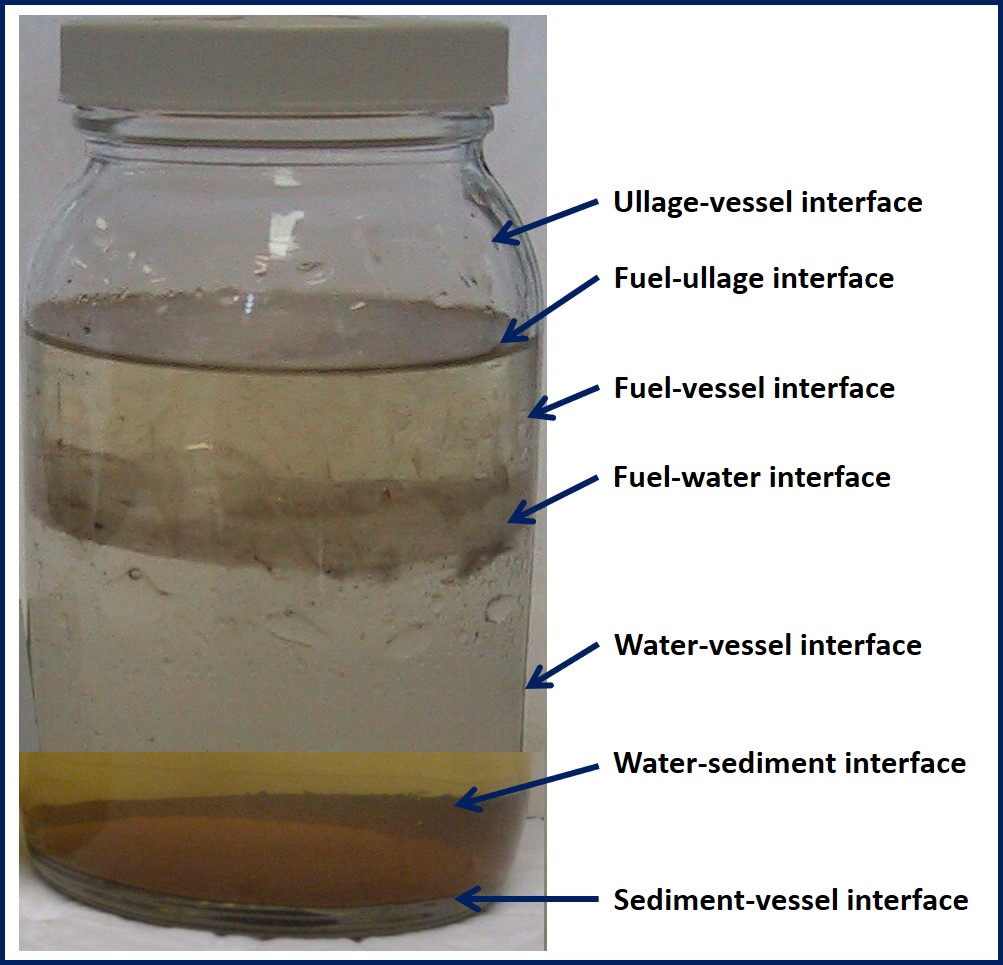
Interfaces are zones where two or more components of a system come into contact with one another. Figure 1 illustrates the interfaces found in fuel systems:

  • Fuel-vessel – the surface of tanks and other system components that are in contact with fuel.
  • Fuel-water – the surface at which fuel and fuel-associated water meet. The primary fuel-water interfaces are between fuel and bottoms-water, and between fuel and biofilms (slime layers) coating system surfaces.
  • Fuel-headspace – in fixed roof tanks, the fuel’s surface that is in contact with the tank’s air/vapor zone (ullage)
  • Water-vessel – areas of direct contact between fuel-associated water or biofilm and system surfaces.
  • Water-sediment (sludge/sediment) – the top surface of any sludge or sediment layer hat has accumulated on the tank bottom.
  • Sludge/sediment- vessel – the interface between sludge or sediment and tank bottom.
  • Vapor-vessel – exposed surfaces in a fuel tank’s ullage zone.

Fig 1. Fuel system interfaces.

The best fuel system microbial contamination diagnostic samples come from tank bottoms or interfaces. In practical terms, these are typically tank drain or bottom grab samples.

Sample collection – bottom drain

Supplies

  • Absorbent spill pads
  • Alcohol – methanol or ethanol liquid or wipes
  • Bottle, clear glass, Boston round, or HDPE, wide-mouthed, 500 mL.
    Note: Clear glass makes it easier to observe phase, particulates, etc. However, analytes, such as adenosine triphosphate (ATP) can adsorb onto glass – making HDPE the preferred container material for samples to be tested for ATP.
  • Bucket, 5 gal (20 L)
  • Funnel
  • Gloves, surgical
  • Rags, shop

Procedure

  •    1. Place absorbent spill pads on ground around drain to ensure that any spillage or splashing will be captured by pads.
  •    2. Don gloves to protect hands and to reduce risk of contaminating sample with microbes from your skin.
  •    3. Use alcohol to wipe down exposed surfaces of bottom-drain and funnel.
  •    4. If there is sufficient space between ground (floor) and drain, place sample bottle into bucket and place bucket under drain.
  •    5. Remove cap from sample bottle, place wide-end of funnel under drain and narrow-end into sample bottle.
  •    6. Open drain and fill sample bottle approximately 75 %.
  •    7. Close drain, remove funnel from sample bottle, replace cap, and label sample bottle with:
          a. Sample source identification
          b. Sample collection date and time
          c. Identity of sample collector
  •    8. If sample is not going to be tested immediately, place in ice of refrigerator.

Sample collection – bottom grab

  • Absorbent spill pads
  • Alcohol – methanol or ethanol liquid or wipes
  • Bottle, clear glass, Boston round, or HDPE, wide-mouthed, 500 mL.
    Note: Clear glass makes it easier to observe phase, particulates, etc. However, analytes, such as adenosine triphosphate (ATP) can adsorb onto glass – making HDPE the preferred container material for samples to be tested for ATP.
  • Bucket, 5 gal (20 L)
  • Funnel
  • Gloves, surgical
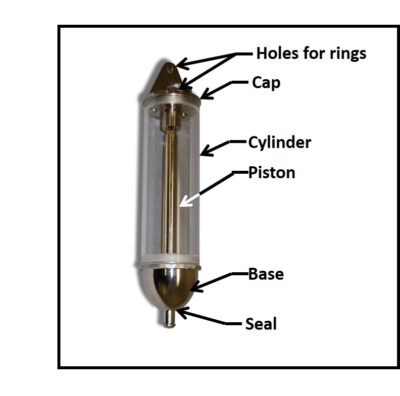
  • Sampler – Bacon bomb or bailer (figure 2)
  • Sounding tape

Fig 2. Bottom samplers – a) Bacon Bomb; b) bailer.

Procedure

  •    1. Place absorbent spill pads on ground around drain to ensure that any spillage or splashing will be captured by pads.
  •    2. Don gloves to protect hands and to reduce risk of contaminating sample with microbes from your skin.
  •    3. Use alcohol to wipe down the sampler and funnel.
    Note: If multiple samples are being collected, and the previous sample contained visible sludge, sediment, or both, use clean fuel to rinse out the sampler before disinfecting its internal surfaces.
  •    4. Place sample bottle into bucket.
    Note: This serves two purposes: 1) it reduces the risk of spillage onto ground around sampling bottle; and 2) it shields sample bottle from the view of those who are not directly involved in the sampling process – this is particularly important when sampling retail site underground storage tanks.
  •    5. Attach sampler to sounding tape and lower the sampler into the tank until it touches the tank’s bottom but remains vertical.
    Note: Follow standard fuel handling safety precautions to ensure that the sounding tape is properly grounded and that there is no risk of sparking.
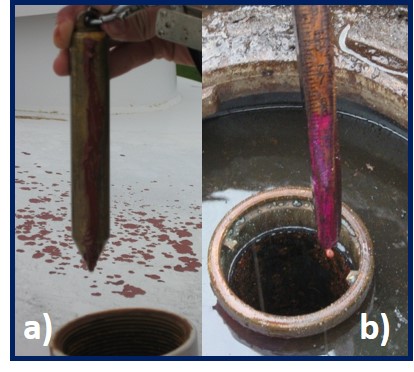
    Note: Best practice is to first determine the height of any free-water in the tank (figure 3).


    Fig 3. Using water-detection paste to determine height of free-water in tank-bottoms – a) sounding plumb-bob; b) sounding stick. Both devices had been coated with white, water-detection paste that had turned purple on contact with water.
  •    6. Remove cap from sample bottle, place narrow-end of funnel into sample bottle.
  •    7. Recover sampler and place it over funnel.
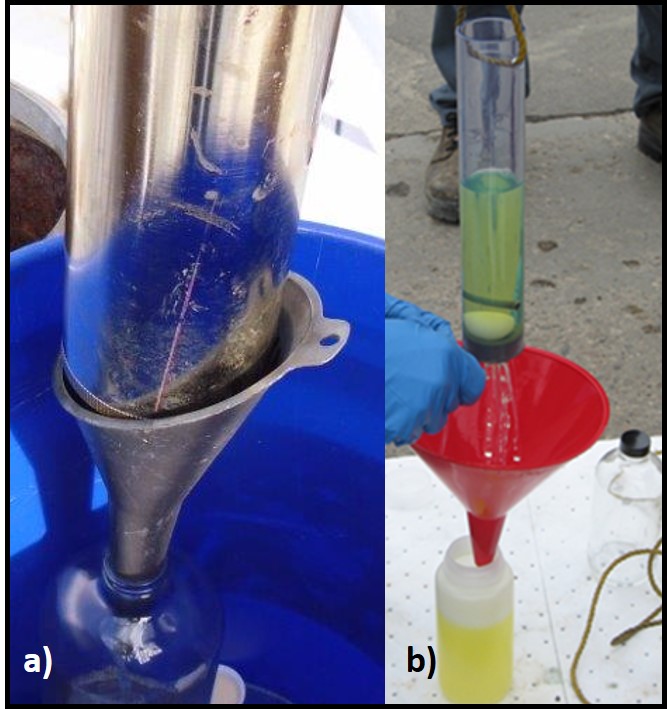
  •    8. Drain contents of sampler into sample bottle (figure 4).

    Fig 4. Transferring bottom-samples to sample bottles – a) draining Bacon Bomb sample into glass bottle; b) draining bailer sample into HDPE bottle.
  •    9. Remove funnel from sample bottle, replace cap, and label sample bottle with:
          a. Sample source identification
          b. Sample collection date and time
          c. Identity of sample collector
  •    10. If sample is not going to be tested immediately, place in ice of refrigerator.

Sample handling

Best practice is to keep samples chilled (40  2 F; 5  1 C) and to begin microbiological testing within 4h after collection Fuel & Fuel System Microbiology Part 6 explains sample perishability. Samples that have been kept chilled can be tested reliably for up to 24h after collection. The total level of microbial contamination and types of microbes present in the sample are increasingly likely to change as sample age beyond 24h. This makes the test results less likely to reflect conditions inside the tanks from which the sample was originally collected. Consequently, the risk of either failing to detect heavy microbial contamination or incorrectly concluding that actually had negligible contamination when sample was heavily contaminated, increases with sample aging. Microbiological tests like ASTM Method D7687 for ATP are easy to run in the field, immediately after sample collection. Using this type of test eliminates the risks caused by sample aging.

The details

This brief explanation of sampling procedures will get you started on the right path. However, circling back my opening comments, I recommend using ASTM Practice D7464 for detailed, step-by-step sampling instructions, and referring to my sampling chapter in ASTM Manual 1 for a full discussion of the considerations that should be taken into account when deciding when and when to collect samples for microbiological testing. I also address sampling in considerable detail in BCA’s six-module fuel microbiology course. For more details about this course, please contact me at either fredp@biodeterioration.control.com or 01 609.306.5250.
Beginner’s Mind – What does this have to do with fluid management?

In the June issue of Lubes’n’Greases, Jack Goodhue wrote a an article about the Zen concept – shoshin – beginner’s mind.  Normally a fan of Jack’s Your Business column, I was surprised by how far off the mark he was in his understanding of shoshin.  I wrote a letter to the editor to express my concerns, and a condensed version of my letter was published in this month’s issue. I believe that when used appropriately, shoshin is of tremendous value to business leaders.  My full letter to the editor (Caitlin Jacobs) provides a more detailed argument than the version of the letter as it appeared in Lubes’n’Greases. I’ve copied and pasted it here.  In the version below, I’ve added a few links to articles that explain shoshin in more detail than I have in my letter. I look forward to reading your comments.

===

Dear Caitlin:

I generally enjoy reading Mr. Goodhue’s Your Business articles in each month’s LNG, but found myself scratching my head while reading his critique of shoshin in his June 2019 offering. His comments made me think of novice mariners failing to recognize that, as important lighthouses are as aides to navigation, their very presence represents a hazard to navigation – follow the line of sight track toward the beacon for too long and you’ll run aground.

No doubt, Mr. Goodhue accurately reported Mr. Fogel’s comment about shoshin. It’s a shame that he didn’t then do a bit of research on the beginner’s mind concept before writing his essay. Prof. Daniel Kahneman, a psychologist who is also Nobel laureate in economics has waxed long and poetic about our tendency to be blinded by preconceptions. In many professions, true experts are able to respond to cues and react appropriately seemingly without thought. Air Force Col. John Boyd canonized this ability as the OODA – observe, orient, decide, act – loop in areal combat. The pilot with the shortest OODA loop wins the dogfight. In Prof. Kahneman’s terms this is “fast thinking.” Malcom Gladwell’s “Blink: The Power of Thinking Without Thinking” is a paean to fast thinking. However, as Prof. Kahneman explains in “Thinking, Fast and Slow,” although the ability to react quickly with limited data is no doubt beneficial in some circumstances, it is not universally so. Snap decisions – used inappropriately – can lead to disastrous results. This often the case when complex issues are being considered.

Developing long-term strategic business plans is one example and root cause analysis is another in which a beginner’s mind is more likely to lead to success. As explained by D. T. Suzuki – the Japanese Buddhist scholar largely responsible for expanding western readers’ awareness of Buddhist and Zen thought – the concept underlying shoshin is to strive to become aware of your biases and preconceptions and to – at least temporarily – set them aside when examining an issue. The idea is to adopt an open mind and to avoid drawing conclusions based on preconceptions rather than available, objective information – first observe without judgment (this is the philosophy underlying brainstorming efforts). With a beginner’s mind, one can accept data, ideas, and information without critique – without filtering through the lens of personal bias. Embracing beginner’s mind during the early stages of problem-solving efforts or during the listening phase of conversations makes an individual more receptive to insights they would otherwise miss.

I’ll offer a case study to illustrate my point. In my work with the petroleum retail sector I often hear about filter plugging from clients who would be better advised to report the issue as slow flow. Retail fuel dispensers are set to deliver product at a maximum flow rate of 10 gpm (40 L/min). Although there are typically at least six different phenomena that can individually cause, or collectively contribute to, reduced flowrate, too many retail site operators assume that slow flow is a symptom only of filter-plugging. A shoshin approach would have stakeholders focus on the objective reality – reduced flowrate. And to ask beginner’s mind questions, such as: “What are all of the things in a retail fuel system that can contribute to flowrate reduction?” Note here, no one is asked to discard their previous knowledge or experience. They are only asked to set them aside in order to see the actual situation more clearly. By understanding that premature filter plugging is only one of several phenomena that cause flowrate reduction, stakeholders are better able to develop a cost effective plan to minimize both the risk and impact of fuel dispenser slow-flow (The opportunity cost of flowrates <8 gpm at an urban fuel retail site is >$250,000 per dispenser per year at a site with 12 dispensers, that per dispenser cost translates to $3 million lost fuel sales opportunity. Beginner’s mind thinking could mean $millions in increased revenue).

I fully agree with Mr. Goodhue. “Achieving shoshin would be difficult for most business people or anyone else more than three years old.” So is metadata analysis. The difficulty of achieving shoshin should not discourage either technical or managerial folks from cultivating the skill. The return on effort and investment in cultivating a beginner’s mind can be enormous when the mindset is used appropriately.

Sincerely,

Frederick J. Passman, Ph.D.

Predicting Water-Miscible Metalworking Fluid Foaming Tendency

In May 2018, ASTM Subcommittee E34.50 on Health and Safety Standards for Metal Working Fluids commissioned a new Task Force (TF) to develop a new Standard Guide for Evaluating Water Miscible Metalworking Fluid Foaming Tendency. Justin Mykietyn, of Munzing, is chairing the TF and the work is being completed under ASTM Work Item 64558. The details are explained in an article that appeared in the August 2019 issue of Lubes’n’Greases magazine, pages 30 to 32. To learn more about the challenges to predicting metalworking fluid foaming tendency in end-use applications, read the article available electronically at ASTM Drafts Guide to Fight Foam.

FUEL & FUEL SYSTEM MICROBIOLOGY PART 29

What Does “Viable But Not Culturable” Mean and Why Should I Care?

In microbiology, the term used to describe microbes that appear to be healthy and active by test methods other than culturing is viable but not culturable – VNBC. Since the term first came into vogue in the 1980s, it has always reminded me of the Monty Python skit in which the customer – played by John Cleese – and the shop owner – played by Michael Palin – debate whether the parrot that Mr. Cleese had just bought was dead or simply resting, check it out at The Parrot Sketch.

Michael Palin (left) and John Cleese (right) in Monty Python’s “Pet Shop Sketch” (1969).

The viability versus culturability debate

The issue is relevant for two reasons. First, if a fuel or other industrial process fluid system (think heat exchange fluids, metalworking fluids, lubricating oils and hydraulic fluids) is home to a population of microbes that are biodeteriogenic (i.e., causing damage to the fluid, the system, or both) but are not detected by culture testing, the risk of experiencing a failure event can high.

Second, the term VNBC has numerous meanings – depending on researchers’ focus. The varied definitions creates confusion among both microbiologists and others who rely on microbiological test results to drive maintenance decisions.

What does viable mean?

The Online Biology Dictionary defines viable as an adjective meaning (“1) Alive; capable of living, developing, or reproducing, as in a viable cell.” ASTM is a bit more helpful offering several similar definitions. From F2739 Guide for Quantifying Cell Viability within Biomaterial Scaffolds we get: “viable cell, n – a cell capable of metabolic activity that is structurally intact with a functioning cell membrane.” D7463 and E2694 offer: “viable microbial biomass, n – metabolically active (living) microorganisms.” These slight variations all agree that viability relates to a microbe’s ability to:

  • function under favorable physical and chemical conditions (more on this in a bit), or
  • to survive in an inactive (dormant) state under unfavorable conditions, and
  • to become active again once conditions improve.

What does culturable mean?

ASTM defines culturable as an adjective: “microorganisms that proliferate as indicated by the formation of colonies on solid growth media or the development of turbidity in liquid growth media under specific growth conditions.” This definition is used in several ASTM standard test methods, guides, and practices.
When microbes reproduce – i.e., proliferate – go through repeated cycles of division – on a solid or semi-solid medium, after approximately 30 generations (doubling cycles, or generations) they accumulate enough mass to form a visible colony. Thirty generations (230) yields approximately a billion cells. Liquid growth media become visibly turbid once the population density (cells mL-1) reaches approximately one million (106) cells – 20 generations. The duration of a single generation varies among microbial species and growth conditions. At present, known generation times range from 15 min for the fastest proliferating bacteria to >30 days (recent discoveries of deep earth microbes suggest that these microbes might have generation times measured in years or decades – the generation time for humans is approximately 30 years). The key point is that culturable, microbes reproduce in or on growth media under specific environmental conditions.

Before leaving our discussion of culturable lets consider time. Microbes with 15 min generation times will turn broth media turbid in 5h to 6h and form visible colonies on solid media within 8h to 10h. For microbes with a 1h generation time, detection as turbidity or colonies lengthens to 20h and 30h respectively. Many culture-based test protocols state that final observations are to be made after 3-days – sometimes 5-days. Any microbe with a generation time longer than 4h is unlikely to produce a visible colony within 5-days. They will not be detected unless observations are continued for a week or longer. For example, the culture test for sulfate reducing bacterial is not scored negative until after 30-days observation. If you end a culture test at 3-days, are all of the slower growing microbes non-culturable?

What are growth media?

Since the mid-1850s, microbiologists have developed thousands of different recipes designed to support microbial growth and proliferation (recall from an early post that growth refers to the increase in mass, and as noted above, proliferation refers to an increase in numbers). Some growth media are undefined. They are simple recipes made up of extracts from yeasts, soy, and animals. These are the components of media used for the most common culture test: the standard plate count. Other media are prepared from individual chemicals. Their recipes can include more than a dozen ingredients. Solid and semi-solid media include a gelling agent such as agar (extracted from seaweed), gelatin, or silica gel. One of the most frequently referenced microbiological media cookbooks – the Difco Manual – lists more than a thousand recipes. Each of these recipes was developed to detect one or more types of microbes. In addition to the diversity of recipe ingredients, growth media vary in pH, total nutrient concentration (some microbes cannot tolerate more than trace concentrations of nutrients), and salts concentration (ranging from deionized water to brine). The microbes targeted for recovery dictate post-inoculation incubation conditions. Some microbes require an oxygen-free (anoxic) environment. Others require special gas mixtures. Microbes also vary widely on the temperatures at which they will grow. Some only grow at temperatures close to freezing. Others require temperatures closer to boiling.

The growth medium defines the chemical environment and the incubation conditions define the physical environment in which microbes are cultured. No single growth medium is likely to support the proliferation of more than a tiny fraction of the different types of microbes present in an environmental sample. Many microbiologists estimate that <0.1 % of the microbes in a sample will be culturable in a given medium. Similarly, we suspect that for every microbe that has been cultured, there are at least a billion that haven’t.


Is my microbe really dead or simply resting? When conditions are unfavorable to either growth, proliferation or both, many different types of microbes have coping mechanisms. For nearly 200 years, we have recognized that some types of microbes can form endospores – their cell wall chemistry changes and metabolic activity ceases. Only in the past 20 years, we have come to recognize that non-spore-forming microbes can enter into a dormant state that enables them to survive unfavorable conditions for centuries or millennia – becoming metabolically active once conditions once again become favorable. Moreover, in some environments, although the microbes are metabolically active, the rate of their activity is so slow as to be nearly undetectable.

Within some fields of microbiology, VNBC refers to microbes that have been injured due to exposure to a microbicide. Pre-incubation in so-called recovery media – improves their ability to reproduce in or on growth media. In my opinion, this is a very myopic view of VNBC.

Microbial ecologists define VNBC as microbes that are metabolically active or dormant in their home environments but will not growth on the culture media and incubation conditions used to detect them.

I first experienced this phenomenon in the 1970s when I was testing water from oilfield production wells. Using radioactive carbon labelled nutrients to measure metabolic activity, my team routinely found that samples that yielded <1 CFU mL-1 (CFU – colony forming unit: “a viable microorganism or aggregate of viable microorganisms, which proliferate(s) in a culture medium to produce a viable colony.” ASTM E2896) held very active populations. Poisoned controls demonstrated that conversion from radiolabeled acetic acid or glucose to radiolabeled carbon dioxide was from metabolic activity – not from a non-biological (abiotic) process.

This means that culture testing invariably underestimates the microbial population density in tested samples. Conversely, because microbes that were dormant in the environment from which they were sampled can become active once transferred into or onto nutrient media, culture testing can overestimate the presence of metabolically cells. For example, most microbes suspended in fuels or lubricants are dormant, but can become active and form colonies on growth media. These issues do not make culture testing good or bad. Culture testing is still the only practical tool for obtaining microbial isolates that can be used for further testing. Moreover, culture testing is a useful condition monitoring tool if you are tracking changes over time. The more important limitation of culture testing as a condition monitoring tool is the delay between test initiation and the availability of test results. In the days or weeks it takes for microbes to form colonies on growth media, they are also continuing to proliferate in the system from which the sample was collected. This is where real-time (10 min) tests such as ASTM D4012, D7687, and E2694 have a major advantage over culture testing.

For more information on the most strategic use of culture or non-culture microbiology test methods, I invite you to contact me at fredp@biodeterioration-control.com.

FUEL & FUEL SYSTEM MICROBIOLOGY PART 28 – IS THE SULFUR IN HIGH SULFUR DIESEL TOXIC?

Diesel fuel biodeterioration is not affected by the fuel’s sulfur content.

There is a broadly embraced misperception about the relationship between diesel fuel’s sulfur content and its toxicity to microorganisms. This misperception is driven by two logical flaws.

Logical argument #1:

There has been an increase in the number of microbially contaminated fuel systems since the use of ultra-low-sulfur diesel (ULSD) became mandatory.

Therefore, microbial contamination in low sulfur diesel (LSD) and high sulfur diesel must have occurred less frequently than in currently does in ULSD.

Logical argument #2:

If argument #1 is valid, then the removed sulfur must have had a biostatic (ability to prevent microbes from growing) or biocidal effect.

“Get your facts first, and then you can distort them as much as you please.”

This quote was reportedly part of a session that Samuel Clemens (Mark Twain) has with young reporters sometime in the 1890s. More recently, in one of his many books on Zen, the philosopher Alan Watts, observed that humankind is unique in our uncanny ability to make precise and accurate observations only to use them to draw erroneous conclusions. Finally, in an earlier post I quoted Daniel Kahneman’s adage: “What you see is all there is.” (WYSIATI).

Logical argument #1 fallacies:

This argument assumes that the increased incidence of reports in a particular market sector (fuel retail) is equivalent to the increased incidence of microbial contamination in diesel fuels and fuel systems. But how do we know whether stakeholders are simply more aware of something that has been going on since diesel fuels were first used? The history of marine fuel oil biodeterioration that date back to the transitions from coal to oil and from burner oils to marine diesel fuel oil (more on this, in response to argument #2). Distillate aviation fuel biodeterioration has been recognized since the Korean War.

Additionally, the argument ignores various confounding factors (in statistics, a confounding factor is an unobserved variable that affects observed variables: in our case sulfur concentration and biodeterioration are observed variables. Before concluding that removing sulfur made diesel fuel more vulnerable to biodeterioration consider these four confounding factors (there are others, but these five illustrate the concept):

  • Hydrotreatment to remove sulfur also removes aromatic compounds – especially high molecular weight, toxic, polynuclear aromatic compounds.
  • During the past three decades, the fuel distribution infrastructure has evolved from vertically integrated control (the refiner controlled all stages from refinery to retail site) to fungible (common pipelines transport products from refinery tank farms to terminals from which independent and branded retailers draw product from tanks that can that can be mixtures of product from numerous refineries – >100 refineries produce product that is stored in in New Jersey terminal tanks). Fungible product comingling means that cradle to grave product stewardship is more complex than it was historically.
  • Product transport from terminals to fleet operators and retailers is typically done my third-party transport companies. Switch-loading (a given tank compartment can carry gasoline on one trip and diesel on the next) is occurring more frequently. The probability of cross-contamination between two fuel-grades is a hotly debated issue at present.
  • Although the trend is beginning to reverse itself, between 1990 and 2010, total diesel storage capacity shrunk annually as product demand grew. Consequently, residence time in terminal storage tanks has decreased. Although best practice is to give water and particulates time to settle before drawing product from a tank to the fueling rack, product demand can inspire terminal operators to begin drawing product early. Consequently, any water, particulates, or both that have not settled to below the suction zone will be transported with the fuel.
  • Dispensing system technology has become more sophisticated. Systems that might not have be affected historically, are now failing – primarily due to corrosion damage. As a microbiologist, I’d like to think that all fuel system corrosion is microbiologically influenced corrosion (MIC). However, if ethanol enters diesel fuel systems (either because of switch loading or vapor recovery unit vapor comingling) it can be chemically oxidized to acetic acid. Therefore, unless other low molecular weight (4 to 6-carbon) organic acids are also present, high concentrations of acetic acid in fuel-associated water is likely to be a symptom of chemical – not microbial – activity.

Logical argument #2 fallacies:

This argument is built on argument #1’s house of cards. It falls apart if the statement: “There has been an increase in the number of microbially contaminated fuel systems since the use of ultra-low-sulfur diesel (ULSD) became mandatory.” is false. As noted above, increased incidence and increased reports are two very different concepts.

To illustrate this point, consider the respiratory disease, legionellosis. The disease was given its name because the first recognized outbreak was among American Legion members attending a convention at the Bellevue-Strafford Hotel, in Philadelphia. It is beyond improbable that the bacterium that causes legionellosis – Legionella pneumophila – came into existence in 1976. However, in late July and early August 1976, after 221 American Legion convention attendees developed pneumonia-like symptoms, and 34 of the patients died, the medical establishment (physicians and epidemiologists) took note. It took a couple of years to figure out how to culture L. pneumophila, and there was wild speculation regarding the likely relationship between environmental conditions and the microorganism’s ability to grow. Forty years down the road, we know that L. pneumophila is ubiquitous – it can be found in many different environments where biofilms develop (relax – none yet recovered from fuel systems; but don’t relax too much – shower-head aerator screens tend teem with L. pneumophila). The good news is that only immunosuppressed individuals tend to develop the legionellosis.

What does this have to do with the relationship between sulfur concentration in fuel and biodeterioration risk? In both cases, the microbes causing the symptoms have been around for a long time. In the health sector, for centuries (if not millennia) L. pneumophila has caused an unknown percentage of all pneumonia cases, but it was never identified because there had never been (i.e., since the advent of modern medical microbiology, immunology, and epidemiology) such a large number of folks getting sick at the same time and place. Similarly, fuel biodeterioration was well known from the earliest days of gasoline and diesel production. However, there was no database documenting each biodeterioration event.

Prior to 2012 the upper limit for sulfur in marine diesel was 4.5 %. Before 1986, on-highway diesel typically had 0.1 % to 0.5 % (by volume) sulfur. If the sulfur in these historical fuels had been biostatic, fuel biodeterioration would have not occurred until ULSD came onto the market. Filter plugging on ships and aircraft had a more serious impact than filter plugging on dispensers, locomotives, and other land-based diesel fuel systems. However, efforts to control microbial contamination in the marine and aviation sectors were not general knowledge among fuel retailers and fleet operators. Ironically – because they ignored the biocidal effect of tetraethyl lead – folks were convinced that gasoline was too toxic to support microbial growth and that only diesel fuels and fuel systems were affected.

Despite all of this, isn’t it fair to say that ULSD biodeterioration is more pervasive than that of diesel grades with greater sulfur concentrations? My answer is: Not necessarily. There are no hard statistics on the average number of ULSD biodeterioration incidents per year since 1986 and there are certainly no reliable statistics for the decades before the switch to ULSD (or in off-highway systems using low or high sulfur diesel). The assessment that the incidence rate has increased since ULSD replaced other fuel grades for on-highway use is purely subjective. One more time: increased awareness (as in the case of legionellosis) is not the same as increased incidence. The switch to ULSD and biodiesel blends was highly visible to the industry. From the outset, stakeholders wanted to know what the change might do to their systems. Consequently, they now notice damage more quickly than they had in the past. Okay, this is an optimistic statement. In two recent fuel quality surveys, sites originally identified as control sites (no reported problems) had more microbial contamination and corrosion than he problem sites. In the more recent, US EPA-sponsored study, operators were unaware of any problems at 87 % of the moderately to heavily corroded sites.

The Science:

There is no question that some organosulfur compounds are biocidal. For example, two of the few fuel-treatment biocides are mixtures of organosulfur compounds:

CIT/MIT (also referred to as CMIT): 5-Chloro-2-methyl-3(2H)-isothiazolone + 2-methyl-3(2H)-isothiazolone (isothiazolinones are ring structured molecules with the chemical formula: C₃H₃NOS).

MECT: 2-(Thiocyanomethylthio)benzothiazole + Methylene bis(thiocyanate) (the thio in each molecule’s name indicates that they are organosulfur compounds)

However, sulfur is one of the five primary elements (the other four are: carbon, hydrogen, nitrogen, and oxygen) on which all life depends.

Studies on fuel biodegradability have shown that the aromatic content, rather than the sulfur content is a primary factor affecting diesel biodegradability. Regardless of sulfur concentration, fuels with higher aromatic concentrations or more complex aromatic compounds biodegrade more slowly than more severely hydrotreated fuels from which aromatics have been substantially removed. The same hydrotreating process that removes sulfur also reduces fuel’s aromatic content. Note that although there are no aromatic biocides approved for fuel treatment, there are numerous aromatic biocides approved for other applications.

    Bottom line:

If ULSD fuels are more susceptible than higher sulfur content fuels are to biodeterioration, it is due to the reduced concentration of complex, toxic polynuclear aromatic compounds – not because of sulfur’s inherent toxicity.

FUEL & FUEL SYSTEM MICROBIOLOGY PART 27 – RETAIL SITE OPPORTUNITY COSTS REVISITED

Opportunity Cost at the Forecourt

In my first Fuel & Fuel System Microbiology post in November 2016, I wrote about the cost of repairing and remediating sites at which underground storage tanks had leaked. At the time, I have not fully considered that most of this cost burden was borne by insurance underwriters – not site owners.

Today, I want to return to a theme I’ve been writing about since long before my November 2016 blog post: retail site opportunity cost. As I write this blog, regular unleaded gasoline (RUL) in my part of New Jersey is retailing for $2.30/gal. For dispensers delivering 8 gpm instead of 10 gpm, this translates to approximately $144,000 per year per dispenser opportunity cost at urban sites that experience four hours per day of rush hour traffic – periods during which customers must wait in line to purchase fuel.

In this blog post I’ll share some simple computations on the relationship between dispenser flow rates and opportunity cost.

What is Opportunity Cost?

Opportunity cost is the difference between the economic value of the theoretically optimal use of an assist and the value realized by its actual use. At fuel retail sites that experience rush hour peaks, where the dispenser flowrate is the primary factor controlling fuel sales revenues, the opportunity cost is the difference between sales generated while dispensing at 10 gpm (U.S. EPA’s maximum permissible flowrate at retail dispensers) and sales generated while dispensing at slower flowrates.

Fuel Retail Opportunity Cost Model

As with all economic models, opportunity cost models are based on assumptions. For fuel retail assume:

  • 1. At state-of-the-art forecourts, submerged turbine pump (STP) capacity is sufficient to ensure that having multiple dispensers operating simultaneously does not reduce flowrate measurably.

  • 2. Absent flowrate restrictions, all dispensers can deliver 10 gpm.

  • 3. Customers can refuel their vehicles for 30 min per hour – the remaining 30 min are spent moving vehicles, making fuel-purchase selections, completing fuel sales transactions

  • 4. Although rush hour periods at urban fuel retail sites vary, four hours per day is the median – two hours each during the morning and afternoon commuting peaks.

  • 5. Rush hour periods occur five days per week.

  • 6. Current sales price (P) is $2.30/gal.

From these assumptions we can compute the annual opportunity cost (CO) per dispenser.


Where CO is the opportunity cost, P is the sales price in $s, Gmax is the flow rate @ 10 gpm, and Gobs is the observed (actual) flow rate. Note that Gobs can be for each dispenser or the average flow rate measured for two or more dispensers.

Computing CO for 8 gpm flowrate:


Field studies have shown that it is not uncommon for dispensers to operate at 5 gpm to 7 gpm. I’ll leave it to readers to do the math, based on their own flowrate, peak hour, and fuel price data. Don’t forget to multiply the opportunity cost per by the number of dispensers in your forecourt. If you own multiple urban retail sites, don’t forget to multiple your cost per site by the number of sites.

Data and Cognitive Dissonance

The two images under this blog’s title illustrate how our brains interpret what we see. Most viewers will alternate between seeing a man’s portrait and a woman reading a book in the left image. Similarly, when looking at the right image, most will alternate between seeing a goblet and two profiles. Some readers will only be able to see each photo as a single image – subject to only one interpretation.

In psychology, cognitive dissonance is the term used to describe a number of ways humans respond to new information – including how we behave when new infromation contradicts our previously held beliefs. I mention cognitive dissonance here because of the frequency with which I have encountered it whenever I have suggested that a fuel retailer test my model. The few who have go so far as to test their average dispenser flowrates have declined to compute the impact of their test results.

There’s a psychology term for willfully choosing to either refrain from collecting data that you don’t want to see, choosing not to do calculations that will lead to results you don’t want to believe, or both, but you’ll have to look that term up on your own.

The Big Questions

The model I’ve provided in this post addresses only fuel sales. It does not include convenience store (C-store) opportunity costs. For example, ask yourself how many prospective C-store customers choose not to visit the store when they believe that have either waited too long to pull up to a dispenser, that it has taken too long to fill their tank, or both. These delays are major factors contributing to customer fuel quality concerns. The fuel quality might be fine, but customer perception is that a refueling experience that take too long reflects uncertain fuel quality. One major petroleum company determined that they were losing 15 % of their customers due to fuel quality perceptions. In response, they invested heavily in a refinery to C-store cleaning program, followed by an upgraded condition monitoring and predictive maintenance program. They realized a tremendous return on their investment.

If you are a petroleum retailer who relies on a service company to perform the monthly checks required by the current underground storage tank regulations, what would your incremental costs be to include the additional condition monitoring and predictive maintenance actions needed to reduce your opportunity costs by 10 %? What would your return on investment be?

As always, please share your thoughts with me by writing to fredp@biodeterioration-control.com.

FUEL & FUEL SYSTEM MICROBIOLOGY PART 26 – THE NFPA CONUNDRUM

I thank Michelle Hilger for inspiring me to write about today’s topic – the disconnect between the guidance NFPA provides about emergency generator fuel supplies and reality. Michelle chairs the Emergency Generating Systems Association’s (EGSA’s) Fuel: Fact or Fiction Working Group.

NFPA (National Fire Prevention Association) Standards Related to Fuel Storage

The NFPA provides fuel condition monitoring guidance in two documents:

  • NFPA 110, Standard for Emergency and Standby Power Systems; and
  • NFPA 25, Standard for the Inspection, Testing, and Maintenance of Water-Based Fire Protection Systems.

During her brief, presented to ASTM D02.14’s Fuel Microbiology Working Group in June 2018, Michelle reported that NFPA 110 prescribes the following:

  • Chapter 8.3.7 -A fuel quality test shall be performed at least annually using appropriate ASTM standards or manufacturer’s recommendation (Revision for 2019 Edition)

She also reported similar language in NFPA 25:

  • Chapter 8.3.4.1 –Diesel fuel shall be tested for degradation no less than annually.
  • Chapter 8.3.4.1.1 –Fuel degradation testing shall comply with ASTM D975, Standard Specification for Diesel Fuel Oils

Ensuring that fuel in emergency system storage tanks is fit for purpose is laudable, but insufficient.

What’s the Problem?

Some years ago, a maintenance engineer at a major resort hotel estimated that if there was a power outage and the hotel’s generators did not start and operate reliably, it would cost the hotel’s owners more than $2 million for each minute the facility was without power. Now ponder what the cost impact might be – in dollars and possibly lives – if a hospital’s emergency power system did not operate when needed (you can find some statistics if you research the impacts of recent hurricane disasters in Florida, Louisiana, Texas, and other southern states.

There is no debate that it is imperative to check the condition of stored fuel periodically. However, just determining that the bulk fuel meets ASTM D975 Table 1 specifications provides no information about the fuel system’s condition.

For several years – beginning with efforts to have proposed revisions incorporated into NFPA 110’s 2016 edition – the ESGA has been trying to educate NFPA stakeholders and broaden the scope of prescribed fuel system inspections.

For those of you who are new to this blog series, I invite you to start with my November 2016 post and read the entire series. This will help you to understand the rationale for ESGA’s efforts. In today’s post, I’ll just highlight two of the most important issues.

Fuel Quality Testing is a Snapshot

ASTM product fuel specifications were developed and are frequently revised to ensure that entities supplying and entities purchasing product have a common understanding of the criteria by which that product is defined as being fit for purpose. ASTM (and other consensus standard bodies – for example the International Standards Organization (ISO)) standards list parameters, test methods and pass/fail criteria that stakeholders can use to ensure that the product is fit-for-use at the time of sampling. Specification test results do not predict the product’s future condition. Under optimal storage conditions, emergency diesel generator fuel can be stored for prolonged periods (years). However, optimal storage isn’t always possible.

Fuel Versus Fuel System

Although my personal focus is microbial contamination and biodeterioration, in ASTM D6469 Guide for Microbial Contamination in Fuels and Fuel Systems I openly acknowledge that one major challenge to biodeterioration diagnosis is the number of symptoms that biodeterioration shares with non-biological (abiotic) fuel and fuel deterioration processes. Fuel can accumulate water and particulate matter. It can also become corrosive. Most engines can operate – at least for some time – using degraded fuel, but there’s a cost. CRC Report 667 Diesel Fuel Storage and Handling Guide (Coordinating Research Council, Alpharetta, GA, 2014) summarizes the most common fuel deterioration symptoms, their causes, and best practices for preventing problems. Two Energy Institute (EI) guidance documents are scheduled for publication in 2019:

  • Guidelines for the investigation of the microbial content of liquid fuels and for the implementation of avoidance and remedial strategies; and
  • Guidelines on detecting, controlling, and mitigating microbial growth in oils and fuels used at power generation facilities.

In the U.S., the Diesel Fuel Oil Group (DFOG) – a consortium of nuclear power industry professionals responsible for diesel fuel oil storage at power generation facilities – in collaboration with the Institute of Nuclear Power Operations (INPO) – has recently published:

Practice Guide: Management of diesel fuel quality for emergency diesel generators at nuclear power stations.

The publications coming from CRC, DFOG & INPO, and EI reflect the stakeholder community’s growing recognition of fuel system condition monitoring in addition to fuel quality testing.

What Needs to Happen

For many owner and operators, NFPA standards don’t just dictate minimum condition monitoring actions, they dictate all actions. If it isn’t prescribed in NFPA 110, then emergency generator system owners typically choose to avoid the incremental expense of fuel system condition monitoring. Historically, emergency standby diesel power generation system failures have cost tens of millions of dollars and countless lives.

EGSA has proposed new language for inclusion in NFPA 110 Chapter 8:

8.3.7 –Diesel fuel maintenance and testing shall begin the day of installation and first fill in order to establish a benchmark guideline for future comparison. Diesel fuel shall be tested for degradation no less than twice annually, with a minimum of six months between testing. All testing shall be performed using ASTM approved test methods and meet engine manufacturer requirements. Fuel testing shall be performed on all diesel fuel sources of EPSS.

8.3.7.1 –Tests shall include at minimum, Microbial Contamination per guidelines referenced under ASTM D6469, Free Water and Sediment (ASTM D2709), and Biodiesel Concentration (ASTM D7371). Similar, modified, and proven methods recognized under ASTM shall be accepted. For acceptable values consult with the engine manufacturer and most current ASTM test documents -ASTM D975-18, and the Appendix X3.1.3 of ASTM D975-18, Standard Specification for Diesel Fuel Oils.

8.3.7.2 –For diesel fuel stored consecutively for 12 months or longer, a diesel fuel stability test shall be performed annually. PetroOxy (ASTM D7545) is the accepted ASTM test method for S15 diesel fuels containing up to a biodiesel blend of 5% and less. Additional methods may be acceptable, refer to most current ASTM test documents -ASTM D975-18, and the Appendix X3.1.3 of ASTM D975-18, Standard Specification for Diesel Fuel Oils.

8.3.7.3 –Any additional testing requirements shall be determined by equipment manufacturer, government regulations, recent test results, and geographical region. Refer to the most current NFPA 110 Annex A, ASTM D975 Appendix, and the CRC Report No. 667, Diesel Fuel Storage and Handling Guide for detailed testing and descriptions.

8.3.7.4 –If diesel fuel is found to be outside of acceptable range in the testing listed in 8.3.7.1, the fuel shall be remediated to bring back to the required fuel quality for long-term storage specified under ASTM. Remediation may be in the form of fuel additives, polishing, tank cleaning, or diesel fuel replacement, and will be dependent of the test results received.

It’s time for NFPA to adopt these proposed changes and thereby substantially reduce the risk of emergency generators failing to operate when needed. Similar changes should also be made to NFPA 25.

As always, please share your thoughts with me by writing to fredp@biodeterioration-control.com. For more information about EGSA’s activities, contact Michelle Hilger at mihilger@gentechus.com.

FUEL & FUEL SYSTEM MICROBIOLOGY PART 25 – AND NOW FOR SOMETHING COMPLETELY DIFFERENT

In my October What’s New blog post, I highlighted several of my primary takeaways from PEI’s 2018 convention. In this post, I’ll focus on one new commercial offering. If it works as promoted, this system can be a game changer for contamination control in underground storage tanks (UST). At the convention Veeder-Root showed a model of their new CleanDiesel In-Sump Fuel Conditioning System (ISFC). I haven’t seen any field data from retail or commercial sites using this system, so I’m not able to endorse the system (I asked Veeder-Root for permission to discuss their system but have no financial interest in their company or this filtration system). Still, I think it is an exciting innovation with great potential.

The Issue

As I’ve discussed in previous articles – including my paraphrasing of Rebbeca Moore’s summary of contamination typically present in a 7,500-gal fuel delivery (i.e., 1 cup (∼0.25 L) of dirt + 1 to 2 gallons (3.8 L to 5.6 L) of water + up to 325 gallons of FAME (B5 ULSD is now included in ASTM Specification D975 Diesel Fuel Oils) + 1 gallon of glycerin + 5 to 40 gallons of additives). These concentrations of dirt and water are traces (<9 ppm by volume dirt and <200 ppm by volume water) on a per delivery basis, but they add up over time. For example, a UST receiving weekly ULSD deliveries will also received 52 gal to 104 gal (∼200 L to 400 L) of water per year. Even if only 10 % of the delivered water settles out, that’s plenty of water to provide an excellent niche in which microbes can facilitate microbiologically influenced corrosion – MIC (see
Fuel Microbiology Part 19 from April 2018
). Amongst fuel industry folks who specialize in product quality control, the consensus is to minimize water accumulation in UST. As I discussed in Part 19, keeping tanks water-free is easier said than done.

Veeder-Root’s CleanDiesel In-Sump Fuel Conditioning System

I’ve copied figure 1 from Veeder-Root’s ISFC flier and added a few component labels. According to Veeder-Root, the ISFC uses recirculated fuel to create turbulence in fluid at the bottom of the UST. This turbulence causes water, sludge and sediment to be suspended into the product. These resuspended contaminants are then pulled through a perforated inlet component and subsequently flow through a particulate filter and water separator before the polished fuel is recirculated back into the tank. In theory, the turbulence and contaminant capture zones are both sufficient to prevent contaminants from accumulating anywhere along the UST’s bottom.

Potential Impact

When I saw the ISFC demonstration at Veeder-Root’s PEI Convention booth, I thought that the design was simple, elegant, and promising. Its design includes modes that trigger polishing when water is detected by the automatic tank gauge or by a timer (system activated for some number of minutes per scheduled interval). My principal concerns were about the dimensions of the turbulent zone and the polishing system’s contaminant capture efficiency. If only a fraction of the UST bottom is resuspended, water, sludge, and sediment will still accumulate elsewhere along the UST bottom. Any particulate or water contamination that’s resuspended will begin to settle immediately after the recirculation cycle ends. This could create a mechanism for redistributing – rather than removing – contaminants. Another concern is system maintenance. Veeder-Root has estimates of expected filter life. Additionally, they have sensors to measure pressure drops across the filtration unit and water levels in the water separator. Still I can’t help but wonder if sites using the ISFC will quickly grow tired of either having in-house staff or contractors keep up with system maintenance (i.e., changing filters and removing water). My concern here is based on my experience with several petroleum companies who had installed filtration systems between their terminal tanks and racks, only to later remove them because of the filter element replacement costs.

Bottom Line

I think that the ISFC has great potential – even if it’s less than 100 % effective. It directly addresses many of the current challenges related to keeping water and particulates from accumulating on the bottom of UST. I hope that within the next year or two, Veeder-Root will be able to publish a case study or two reporting the impact of ISFC installation and operation at retail and commercial sites. I encourage anyone interested in learning more about the ISFC to contact Diane Sinosky, Veeder-Root’s Global Product Manager, ATG. Diane can be reached at dsinosky@veeder.com. Of course, I always welcome your fuel & fuel system comments and questions at fredP@biodeterioration-control.com.

OUR SERVICES

  • Consulting Services
  • Condition Monitoring
  • Microbial Audits
  • Training and Education
  • Biocide Market Opportunity Analysis
  • Antimicrobial Pesticide Selection

REQUEST INFORMATION


    captcha