Archive for the ‘Uncategorized’ Category


FUEL & FUEL SYSTEM MICROBIOLOGY PART 9 –TEST METHODS – BOTTOM SAMPLE GROSS OBSERVATIONS

Beginning with this post, I’m moving into Phase 3 of this series. In the first five posts, I introduced the issues that make fuel system microbiology condition monitoring important.  In Part 6 through 8 I covered the foundational concepts of sampling and testing.  Now it’s time to talk about actual test methods. The take home lesson here is that you can detect microbial contamination without having a lot of technical training or investing in expensive laboratory facilities.

Gross observations are tests that rely only on our senses.  We look at, sniff, and, perhaps, touch samples to determine whether they are likely to be heavily contaminated.   We begin by obtaining a useful sample.  If you are not sure what I mean by useful sample please read my 28 November 2016 blog post on sampling.

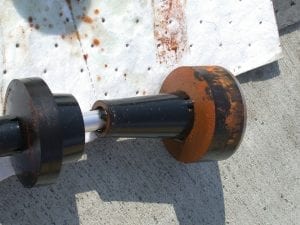
Bottom-sample gross observations work best if you collect the sample from the lowest point in the tank.  Underground storage tanks settle unpredictably.  The first-time a UST is filled, its 90,000lb weight compresses the backfill on which it rests.  Regardless of how well the backfill is prepared, some areas will be softer than others.  The UST will continue to compress the backfill for years.  This means that it is important to check its trim (angle at which the UST lies) annually.  To do this, stick the tank at three points: fill end, turbine end and automatic tank gauge ATG – (usually this will give your fuel levels at each end and the center).  The fuel level will be greatest at the UST’s low point.  Although most UST are installed to be low at the fill end, Murphy’s Law seems to dictate that much of the time, they settle by the turbine end.  Best design is to have an inspection port in the turbine well (figure 1). If find that the UST’s low point is at the turbine end but you can’t sample from that end routinely, sample from the ATG well.  Pulling the ATG will give you a chance to look at the ATG’s water float.  If it looks like figure 2, you most likely have a microbial contamination problem.

Figure 1. Turbine well showing 4in inspection port just left of center.

Figure 2. ATG water float covered with microbial contamination.

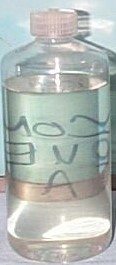
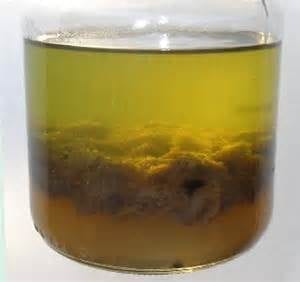
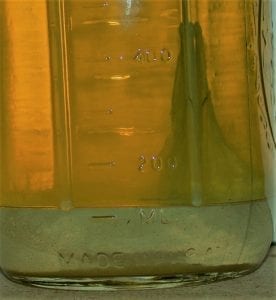
The two samples most likely to provide the best clues about a fuel system’s condition are bottom samples and components (filter, flow-control valve, automatic tank gauge float, etc.).  Let’s focus on bottom samples.  If you pull a sample from a tank’s lowest point, and get a sample that looks like figure 3, you can be fairly certain that you do not have a severe microbial contamination issue.  On the other hand, if your sample looks like the one in figure 4, there’s a >90% probability that the system is heavily contaminated.  Microbes produce chemicals that can emulsify fuel.  Hazy fuel or a third layer, between the water and fuel is a sure sign of microbial activity – particularly if the middle layer sticks to the side of the sample bottle as it does in figure 5.

Figure 3. UST bottom sample: there’s no water, and the fuel is clear and bright; water-white.

Figure 4. UST bottom sample; A thick rag (invert emulsion) layer separates the hazy fuel from the very turbid, bottoms-water.

Figure 5. UST bottom sample: rag layer (looks like a hanging drape)
adheres to the sample bottle wall.

Quick, simple, gross observations provide reliable indications of uncontrolled microbial contamination.  If your eyes tell you the system is clean, then you don’t need to do any more microbiology testing.  If gross observations signal microbial contamination, the next step is to confirm what your eyes are telling you.  I’ve just scratched the surface in this blog.  If you’d like to learn more, please send me an email at fredp@biodeterioration-control.com.

FUEL & FUEL SYSTEM MICROBIOLOGY PART 8 – CHOOSING TEST METHODS B

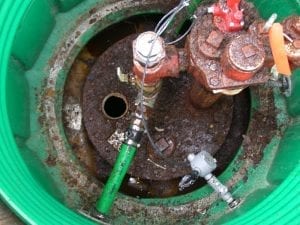
STP spill containment well.  Good news: well has a 4 inch port for testing bottoms-water height and collecting bottoms samples.  Bad News: there is lots of corrosion.

The canary in the coal mine….

In my last post, I discussed the kinds of questions that should be asked before deciding on what tests to run and how frequently to run them.  Now I’ll share my condition monitoring (CM) philosophy with you. I’ll list them as axioms – statements that should seem obvious to the most casual of observers. 

Axiom 1: For most frequent testing, rely on methods that are easy to perform and interpret.  The flow-rate example that I shared in Part 7 (16 February 2017) illustrates this point.  You can test dispenser flow-rate while filling your vehicle.  The only test equipment you need is a stop watch, or flow-rate APP (I don’t want to be commercial here, but I know of at least one fuel system service company that offers a free, dispenser flow-rate APP). 

Axiom 2: The tests you run most frequently should be your canaries in the coal mine1.  I call these simple, frequently run tests 1st Tier tests.  They don’t tell you much about why there is a problem, but signal either that a problem exists, or that the risk of a problem developing has increased.  Examples of other 1st Tier tests include:

  • Bottoms-water detection, by water-paste on fuel gauging stick or sounding bob.
  • Standing water in spill containment wells.
  • Broken spill containment well covers.
  • Heavily corroded submerged turbine pump (STP), turbine distribution manifold (see photo above).

The common feature of these tests is that they require very little technical training or test equipment.

Axiom 3 (repeat from Part 7): Every parameter that you test must have control limits! You need to know what is normal and what isn’t.  I like the green, amber, and red light approach. 

  • When conditions are normal, you have a green light.
  • When conditions are not quite normal, but operations don’t seem to be affected, you are in the amber light zone. This is the time to run additional tests or schedule preventive/early corrective maintenance. This is the zone that links CM to predictive maintenance (PdM – see Part 5).
  • The red-light zone indicates that you are having problems. You need to schedule corrective maintenance as soon as possible. When your site has a well-planned, well executed CM program, you never get red zone test results. Red-light results signal both operational and PdM program problems.

Axiom 4: 1st Tier, amber-light results should trigger either maintenance actions or 2nd Tier tests.

  • Action example: if you detect water in a spill containment well or tank bottom, remove it. There’s no need for additional testing to help you determine the best course of action.
  • 2nd Tier testing example: If your dispenser flow-rate <80% of maximum, use 2nd Tier testing to determine why.  Remember: slow-flow is not the same as a plugged filter!  There are several chokepoints (for example: screens) between the STP and dispenser nozzle.  Moreover, slow-flow after a 500 000 gal of fuel have passed through a dispenser filter tells a much different story than slow-flow after 50 000 gal have been filtered (see the flow-rate testing example in Part 7).

Axiom 5: 2nd Tier tests should be diagnostic, but sufficiently easy to perform so that a trained technician can complete the testing on-site. In most cases, 2nd Tier test results provide sufficient information to guide maintenance actions.  I break 2nd Tier tests into four categories, and will discuss each category in more detail in the next four MICROBIAL DAMAGE blog posts. I list the categories here:

  • Gross observations
  • Physical tests
  • Chemical tests
  • Microbiological tests

There are rare occasions when the 2nd Tier test results are inconclusive.  Additional testing is needed to diagnose what’s going on.  In most cases, 3rd Tier tests are run at specialty testing labs.  These are labs that have particular expertise in fuel, corrosion, or microbiological testing.  Examples of 3rd Tier testing include:

  • Corrosion deposit analysis
  • Fuel property testing (this typically includes tests listed in ASTM fuel specifications)
  • Bottoms-water chemistry testing
  • Fuel or bottoms-water microbiology testing (detailed tests to determine the types of microbes present)

One very rare occasions, 4th Tier or 5th Tier tests are run to gain a deeper understanding of the processes that increase operational risks.  These higher tier tests are typically run as part of research efforts rather than in direct support of troubleshooting.  There is still quite a bit that we do not know about what causes fuel quality problems and fuel system failures.

As I have noted in previous posts in this series, in each post, I’m peeling back another layer of a complex onion.  If you are impatient and want to learn more now, don’t hesitate to contact me at fredp@biodeterioraiton-control.com. 

1 In the days before electronic oxygen and explosive gas detectors, miners would use canaries as hazard alarms.  If methane or carbon dioxide concentrations became too high, the canaries would die.  The canaries’ sudden silence would alert miners that they needed to evacuate the mine – high methane meant high explosion risk! (more…)

FUEL & FUEL SYSTEM MICROBIOLOGY PART 7 – CHOOSING TEST METHODS A

TEST METHOD SELECTION

How do we select condition monitoring tests?

Parts 3 and 4 of this series introduced the issue of test method selection. Starting with Part 7, I’ll spend the next few posts drilling down into different testing options when you want to evaluate fuel system microbiological contamination.
Today let’s start with two questions. These are the two questions that should drive most predictive maintenance test decisions:
What do I need to know to be sure I have a microbial contamination problem?
→What will I do with test results?
Although microbiology data are useful – even important – they are only part of the story. This means that the first question’s answer is not necessarily microbiology data. In this blog post, I’ll focus on the first question.

What do I need to know to be sure I have a microbial contamination problem?
There’s an old joke in which one person asks another: “Why do you always answer my questions with a question?”. The person to whom the question was posed responds: “Do I?” In the same vein, the answer to What do I need to know? is What will you do with the results? There is no benefit to running any test if the results do not drive some action when the results indicate that conditions are not normal (i.e.: in specification). This means that when a technician is tasked with running a test, they need to know three things:
       • How to run the test
       • What the test results indicate
       • The next action to be taken if the results indicate that conditions are not normal.
Running tests – every test method should be detailed in a standard operating procedure (SOP) document. This SOP can be an ASTM, PEI or other method developed as a consensus standard. It can be a method developed by an employer. As I noted in Part 5, the Navy uses Maintenance Requirement Cards (MRC). A well written SOP lists all materials, supplies and tools needed to perform the task. It lists both hazards and potential interferences. It then provides detailed instructions for how to complete the task. Next, test method SOP specify what to report and how to report the results plus supporting information. Finally, the test method SOP provides guidance on how to interpret the results and what action to take.
What the results indicate – some methods generate numerical data. For example, one of the easiest tests to run is dispenser flow-rate. The technician either determines how long it takes to dispense a specified volume of fuel, or determines how much fuel is dispensed during a fixed time. The results are reported as gallons (or liters) per minute (gpm). Without some context, the results are not particularly helpful. However, we can assign attribute scores to flow-rate ranges; for example:
       • 8 gpm ((30 l/min) to 10 gpm (38 l/min): normal;
       • 6 (23 l/min) gpm to <8 gpm: moderately reduced; and
       •<6 gpm: severely reduced.  For fleet operations, the breakpoints might be 36 gpm (136 l/min) and 24 gpm (91 l/min). 

Having assigned attribute scores to our raw data, we know that the flow-rate of a retail dispenser dispensing fuel at 4 gpm (15 l/min) is severely reduced. Some action is needed.

What action is needed? – most often – particularly for quick and dirty tests – the action triggered by a test result that indicates that there is a problem, is additional testing. In our dispenser flow-rate example, the severely reduced flow can be a symptom of different causes; including microbiological contamination.

For example, if the test is run when several dispensers are being operated, the pump might not have sufficient power to deliver full flow to all active dispensers. An under-capacity pump has nothing to do with microbiological contamination. Alternatively, reduced flow could be a symptom of contamination. Again, not all contamination is microbial. Moreover, the assumption that slow-flow is due to filter plugging can be wrong. This leads to a set of IF/THEN instructions:

     • IF flow <6 gpm, THEN retest after confirming that no other dispensers are operating.
     • IF flow <6 gpm when no other dispensers are operating, THEN replace filter and retest flow rate.
     • IF flow is <8 gpm after replacing filter; THEN clean dispenser prefilter (screen) and retest flow rate.
     • IF flow rate is <8 gpm after cleaning prefilter; THEN test leak detector, replace if necessary, and retest flow rate.
     • IF flow rate <8 gpm after testing/replacing leak detector; THEN test/repair/replace submerged turbine pump and retest flow rate.

Notice that in each case, the level of effort is greater and the flow rate is retested after the action has been completed.
By now, perhaps you are wondering: All this is interesting but what do I really need to know to be sure I have a microbial contamination problem? Stay tuned. In Part 8, I’ll offer some approaches to how you can answer that question.

Flow-rate testing as I’ve described here is one example of tiered testing. Here I reran the same test after taking increasingly complex maintenance actions. In future posts, I’ll write about more tiered testing in which the results from a simple test trigger the need to run a more complex test. I’ll also discuss individual test methods and share my opinions about their respective advantages and limitations. If you are impatient and want to learn more now, contact me at fredp@biodeterioraiton-control.com.

FUEL & FUEL SYSTEM MICROBIOLOGY PART 6 – HANDLING SAMPLES

Changes in population as sample ages

Fig 1. Sample perishability: Changes in population as sample ages


Source: CAERT

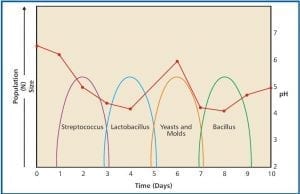
Fig 2. Microbial population succession in Milk. Source: CAERT


Today, I’m returning to the sampling issue that I introduced in Part 2.  In particular, I’ll focus on the concept of sample perishability – the tendency for the contents or properties of a sample to change over time. 

Microbes are living beings.  Like all other living beings, microbes eat, discharge (excrete) wastes, use energy, grow (individual cells get larger), reproduce (proliferate), and respond to their environment.  Samples are perishable because microbes collected in the sample, continue their activities after they have been captured.  They respond to their environment and change it, by using up nutrients and excreting wastes.

Even before active microbes change them, conditions in a sample container are different from those in the system from which the sample was collected.  As a result, microbial populations in sample containers can change in three basic ways:  1) the total number of microbes can change: increasing, decreasing, or remaining approximately the same (in the last case, the number of new cells produces is approximately equal to the number of cells dying); 2) the relative abundance of different types of microbes can change; and 3) the combined (interaction) impacts of these two factors can alter the microbial population in countless ways.

Total bioburden: Figure 1 shows how the total number of cells (bioburden) in a fuel + bottoms-water sample can change as the delay between sampling and testing increases.  Because of these changes, ASTM D7464 recommends that samples be tested within 4h after collections and notes that after 24h, even refrigerated samples are unlikely to have microbial populations that closely resemble those present immediately after the sample was collected.

Relative abundance: Types of microbes that were a major part of the total population in the system from which the sample was collected, are sometimes less able to adapt to the conditions in the sample bottle.  When this happens, both the diversity (number of different types of microbes) and the relative abundance (percentage of the total population each type of microbe represents) can change.  Look at Figure 2. Over the course of the first week or so, after milk is collected, there are typically four major population shifts.  For our purposes the population succession details are unimportant.  What is important is that milk’s microbial population changes dramatically.  The population succession in fuel and fuel-associated water samples has not been well studied, but the evidence that does exist suggests that it does occur. 

Bottom line:  Fuel system samples are perishable because the population beings to change so quickly after samples are collected.  For routine condition monitoring, relative abundance changes aren’t going to affect your action decisions.  However, if the population either increases or decreases dramatically between the time the sample was collected and the time it was tested, operators risk either taking action when it is not needed or failing to take action when it is.  To learn more about fuel system sampling for microbial contamination control, please contact me at fredp@biodeterioration-control.com.

IBB paper on differential ATP test method now available as video

A 5 min, condensed version of my 2014 paper: “A Differential Adenosine Triphosphate Test Method for Differentiating between Bacterial and Fungal Contamination in Water-Miscible Metalworking Fluids” is now available at http://audioslides.elsevier.com/getvideo.aspx?doi=10.1016/j.ibiod.2015.01.006.
The paper describes how the method was developed and validated. This is the first published report of an ATP test method that can quantify microbial biomass and then distinguish between bacterial and fungal biomass.

Metalworking Fluids Biocide Situation – Part A

STLE held our annual meeting in Dallas two weeks ago. During the meeting I had the pleasure of chairing the MWF 210 – Metalworking Fluids Hot Topics course. Too many hot topics to cover in a blog post, so I’ll focus on my course module: Microbicide Regulatory Roulette Wheel.
The metalworking industry is facing a regulatory tsunami. The EU’s Biocidal Products Regulation (BPR; replaced the Biocidal Products Directive in 2012 and became effective in September 2013). Two items of particular note about the BPR. First, as with all chemicals under REACH, products are evaluated based on their assessed hazard instead of the risks they pose (risk is a function of inherent hazard AND exposure; for example: molten lava is extremely hazardous, but only if you are exposed – get close enough – to it). Second, the definition of “biocidal” is astonishingly broad; “Any substance or mixture, in the form in which it is supplied to the user, consisting of, containing or generating one or more active substances, with the intention of destroying, deterring, rendering harmless, preventing the action of, or otherwise exerting a controlling effect on, any harmful organism by any means other than mere physical or mechanical action.” AND “Any substance or mixture, generated from substances or mixtures which do not themselves fall under the first indent, to be used with the intention of destroying, deterring, rendering harmless, preventing the action of, or otherwise exerting a controlling effect on, any harmful organism by any means other than mere physical or mechanical action.” I’m left wondering what might be left in terms of MWF additives. I’ll write more about what is happening in the US in my next post.

MICROBIAL CONTAMINATION CONTROL LIMITS IN FUELS

Last week, I received an email query from Kevin H:
Hi, do you know the RLU limit for diesel i see the IATA say

Here’s my response:
Kevin:

Thank you for your query about the existence of an RLU criterion for ATP-bioburdens in non-aviation distillate fuel.

When I suggested the HY-LiTE test low, medium and high levels, I basically translated from the culture test criteria I had developed from the decision matrix I had been using for BCA’s Biodeterioration Risk Assessments. (high risk: CFU bacteria/L fuel >100). That 100 CFU/L equals approximately 1,000 RLU/L.

At the time I was collaborating with Merck to help them have the HY-LiTE method become the basis for an ASTM standard test method. The HY-LiTE works quite nicely in Jet A, where additive usage and water content vary little among samples.

Regarding the relationship between microbial loads and damage risk:
1. I’ve been doing fuel microbiology for about 40 years.
2. I’ve seen systems that have had high levels of contamination, but no evidence of damage, and systems with low levels of detectible microbial contamination and substantial evidence of microbially-caused damage (filter plugging, system corrosion, degraded fuel, etc.). We still don’t have a reliable model for figuring out when a non-damaging population is going to start causing problems (very similar to humans: there are 10x as many microbes as human cells in and on our bodies. Normally they keep us healthy, but sometimes the same microbes cause disease). Key here is that there is no clear link between microbial load and damage risk. Moreover, microbes found in the fuel are generally not the ones to worry about. It’s the microbes growing on the fuel system surfaces. We work with fuel samples, because they are easier to collect. For this reason, both the EI Petroleum Microbiology Committee and ASTM Fuel Microbiology Working Group advise against setting criteria levels for microbial contamination in fuels or fuel-associated waters. The microbiologists on the IATA microbiology task force also resisted resisted putting criteria into the IATA document until the non-microbiologists wore them down.
3. BCA’s Biodeterioration Risk Assessment looks at climate, system design, operations, maintenance practice, fuel chemistry, bottoms-water chemistry, fuel microbiology, bottoms-water microbiology and system component condition. ATP is only one of 10 different microbiological tests that I use to assess biodeterioration risk.
4. All that said, given the patchiness of microbe distribution in fuel systems, I and most of the other fuel microbiologist that I know tend to be conservative. We agree that detecting microbial contamination tells us much more than not-detecting it. Any positive test result indicates a need for further testing. 1000RLU/L equals approximately 100 CFU/mL = 0.1 CFU/mL. In the UK, drinking water is permitted to have 10^6 CFU bacteria/mL (as long as they are not potential pathogens). IATA set a very conservative control level because filter pulling at 50,000 ft can cause an aircraft to fall out of the sky. Filter plugging on the ground can also stalling, but the net impact is not nearly as dramatic.

Long answer to a simple question. Based on their risk tolerance, different companies (particularly marine, rail and trucking fleets) have set in-house criteria. I recommend using ATP as a canary in the cave test. If you get numbers above background, you should run additional tests. I do not recommend relying on any single test when deciding whether you need to take corrective action.

What’s New – 10 May 2015

BCA’s updated site launched on 07 May. This is the first overhaul since Wendy Dalia (then working on her PhD in marine biology) created the original site in the late 1990’s. Although I’ve kept much of the site’s original content, it has been reorganized to make it easier to find useful information. Let me know what you think.

What’s New – August 2012

Fred Passman Presented with STLE’s P.M. Ku Award

At the 2012 STLE (Society for Tribology and Lubrication Engineering) Annual Meeting in St. Louis, MO, Fred Passman was presented with the P.M. Ku Award; the society’s highest award for meritorious service to STLE…

ISMOS-3 3rd International Symposium on Applied Microbiology and Molecular
Biology in Oil Systems (ISMOS-3) in Calgary, Alberta June 2011.

Now available: Microbial Contamination Control in Fuels and Fuel Systems Since 1980 – A Review

What’s New – November 2011

STLE Recording of Real-time Testing of Bioburdens in Metalworking Fluids Using Adenosine Triphosphate as a Biomass Indicator.

A webinar recording of the Wilbur C. Deutsch Memorial Award winning paper that Fred Passman presented at STLE’s annual meeting is now available for viewing…

This webinar discusses the comprehensive process by which the test method that was ultimately developed into ASTM E2694 was vetted in the laboratory and in a 12-week field evaluation at Caterpillar, East Peoria, IL.

12th International Conference on the Stability and Handling of Liquid Fuels

Now available: Can Non-Chemical Antimicrobial Devices Replace or Augment Fuel-Treatment Microbicides – Presented at 12th Intl. Conf on Stability & Handling of Liquid Fuels, 16-20 October 2011, Starasota FL. Fred Passman and his co-authors Gerry Munson and Robert Kauffman evaluate alternative non-chemical technologies; evaluating them for their ability to inhibit microbial growth & proliferation in fuels and fuel systems

ASTM D 7464 Standard Practice for Manual Sampling of Liquid Fuels, Associated Materials and Fuel System Components for Microbiological Testing

Not exactly breaking news, but the publication of D7464 in the ASTM Annual Book of Standards hasn’t been mentioned in earlier What’s New postings. Initially intended to be a few paragraphs inserted into the existing standard – D4057 Practice for Manual Sampling of Petroleum and Petroleum Products – D7464 provides a comprehensive set of instructions for collecting and handling fuel and fuel system sample when those samples will be tested for microbial contamination. Read more…

Links to Passman Webinars and Podcasts!

Visit BCA’s Annotated List of Other Useful Links to find hyperlinks to Fred Passman’s webinar and podcast recordings.

OUR SERVICES

  • Consulting Services
  • Condition Monitoring
  • Microbial Audits
  • Training and Education
  • Biocide Market Opportunity Analysis
  • Antimicrobial Pesticide Selection

REQUEST INFORMATION


    captcha