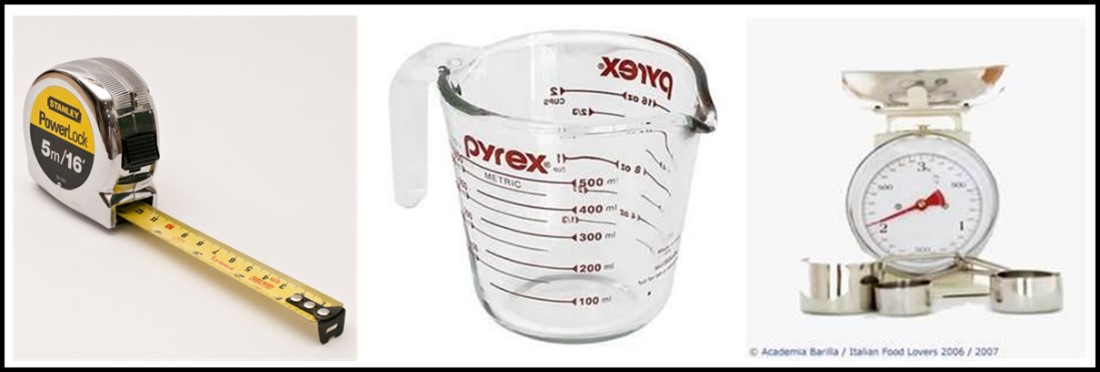
The tool you choose depends on the intended use.
Parts 1 Through 3 Recap
In Part 1 (July 2021), when I started this series on test method comparison, I provided an overview of several basic precision concepts:
- Accuracy
- Bias
- Correlation coefficient
- Regression curve
- Repeatability
- Reproducibility
In Part 2 (August 2021) I explained why it is unrealistic to expect correlation coefficients between two methods, each based on a different parameter (e.g., CFU mL-1 and gene copies mL-1) to be as strong as the correlation between a test parameter and dilution factor. I continued that discussion in Part 3 (September 2021) and elaborated on the concept of attribute score agreement. In this month’s article I’ll provide some sensitivity training.
Conversion Charts
Many manufacturers of test kits use to measure parameters other than culturability (i.e., CFU mL-1) feel compelled to provide conversion charts. I have lost count of the number of emails and phone calls I’ve fielded from test kit users who are wondering why the results of a non-culture test method don’t agree with their culture test results. Most often, the person with the question has used a conversion chart (or equation) to convert parameter X to CFU mL-1.
Conversion charts are meant to be helpful. Non-culture test manufacturers are concerned that in order to embrace new technology, users must be able to convert all microbiological test results to CFU mL-1. First, I believe the test kit manufacturers who provide conversion tables underestimate theory customers’ intelligence. In my opinion, such tables create confusion. Worse, they too often cause users to distrust the data they are obtaining with the non-culture test method. Conversion charts are created based on two assumptions:
1. The correlation coefficient between the non-culture method and culturability will be >0.9, and
2. The relationship between CFU mL-1 and the parameter measured by the non-culture method will never vary.
By now, everyone who has read Parts 1 through 3 recognizes that it is unrealistic to assume that either of these assumptions has any basis in reality. My advice is to ignore any conversion chart that comes with a test kit. Instead, use the recommended categorical designations (i.e., wording similar to negligible, moderate, and heavy microbial contamination), as explained in Part 2. More on this later.
Testing Field (i.e., Actual) Samples
The most appropriate way to compare two microbiological test methods is to run them both on actual samples. The more samples tested by both methods, the better. Minimally, the data set should have non-negative results from 50 samples. Results are non-negative if they are greater than the method limit of detection (LOD). Obtaining non-negative results from 50 samples can be challenging in applications where the action level and LOD are the same. In applications where >90 % of all samples have below detection limit (BDL) microbial contamination, >1000 samples might need to be tested in order to obtain 50 non-negative data pairs. I’ll use ATP testing by ASTM D4012 and culture testing to illustrate my point.
Consider a deionized water (DIW) system for which the culture test control limit/action level = 100 CFU mL-1 (this is the LOD for commonly used paddle – dipslide – tests). The 100 CFU mL-1 control limit was set because that was the method’s LOD. The LOD for ASTM D4012 is 0.1 pg cATP mL-1 (1 pg = 10-12 g). Now assume:
1. Culture testing detects approximately 1 % of all of the viable microbes in an environmental sample (depending on the sample, the microbes, and the details of the culture test method used, recoveries can range from 0.01 & to >10 %), and.
2. The average cATP cell = 1 fg (1 fg = 10-15 g). Although the [cATP] per cell can range from 0.1 fg cell-1 to 100 fg cell-1, >60 years of environmental sampling indicate that an average of 1 fg cell-1 is a reliable estimate of the relationship between ATP-bioburden and cells mL-1.
Note here, I am not recommending that either the 1% value for CFU mL-1 or 1 fg cell-1 be used routinely to convert test data to cells mL-1. I am using these vales only to define detection limit expectations. As Figure 1 illustrates, a 1 mL sample containing 1,000 cells is likely to translate into [cATP] = 1 pg mL-1 (where [cATP] is the cellular ATP concentration in the sample) and 10 CFU mL-1. Based on the LODs I’ve reported above, the ASTM D4012 result will be 10x the LOD and the culture test result will be
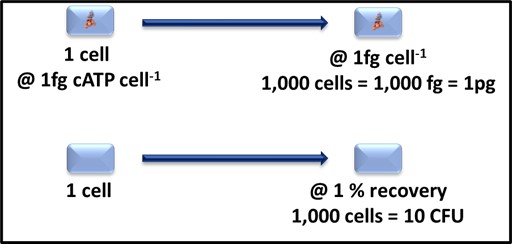
Fig 1. Relationship between cATP 1,000 cells-1 and CFU 1,000 cells-1.
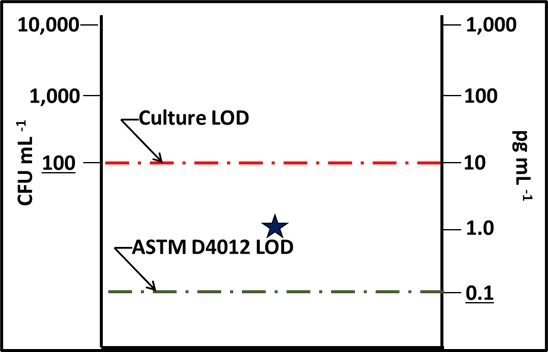
Fig 2. Impact of detection limit (LOD) – star is the test result from a 1,000 cells mL-1 sample. The culture test result was BDL and the ASTM D4012 ([cATP]) result was 1 pg mL-1. The dashed lines indicate the limits of detection for culturability (red) and ASTM D4012 (green).
This LOD difference indicates that there are likely to be samples for which the [cATP] is measurable, but CFU mL-1 is not. This means that D4012 is more sensitive (has a lower LOD) than the culture paddle test.
Now we will look at the results from fifty samples. The LOD for culture testing (LODCFU) is 100 CFU mL-1 (2Log10 CFU mL-1), and the LOD for ATP testing by D4012 (LODATP) is 0.1 pg mL-1 (-1Log10 pg mL-1). Figure 3a is a plot of the Log10 CFU mL-1 (red circles) and Log10 [cATP] data (black triangles). The culture test results are ≥ LODCFU for only 12 of the 50 samples (24 %) and > LODCFU for 8 samples (16 %). However, all of the ATP results are > LODATP. Despite this disparity, the overall correlation coefficient, r = 0.88 (Figure 3b).
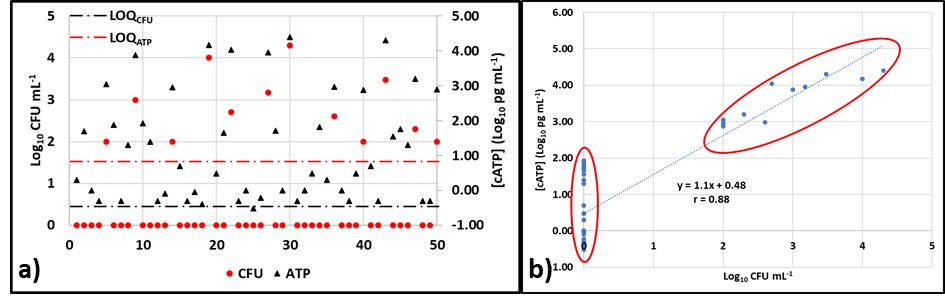
Fig 3. ATP and culture data from 50 samples – a) Log10 data versus sample ID; b) Log10 [cATP] versus Log10 CFU mL-1 showing two clusters: one of ATP < LODCFU and one of both ATP & CFU > their respective LOD.
Perhaps more significant was the fact that although the respective patterns of circles and triangles seem quite different in Figure 3a, if the raw data are converted to attribute scores (see What’s New August 2021), the two parameters agree quite well (Figure 4). Typical of two-parameter comparisons the ATP and culture data yielded the same attribute scores for 74 % of the samples. In this data set, the ATP-based attribute scores were greater than the culture-based scores for the remaining 26 % of the samples. This indicates that the ATP test gave a more conservative indication of microbial contamination. This illustrates why – when comparing tests based on two different microbiological parameters – it is important to run both test methods on a large number of samples. Running tests on serial dilutions of a single sample is likely to underestimate the sensitivity (i.e., LOD) of one of the two methods.
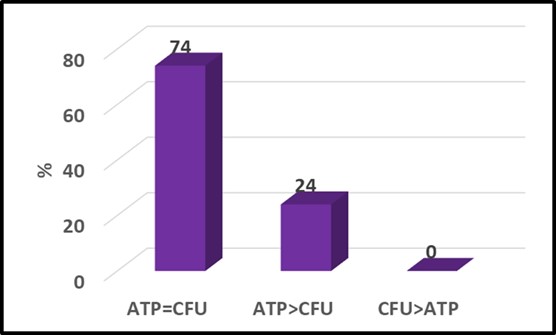
Fig 4. Attribute score comparison – [cATP] (ASTM D4012) versus culture test. Numbers at the top of each column are percentages.
As always, I look forward to receiving your questions and comments at fredp@biodeterioration-control.com.
